7. A study of people who refused to answer survey questions provided the randomly selected sample data shown in the table below. At a = .01, test the claim the cooperation of the subject response or refusal is independent of age category.

Homework Answers
( 7 )
| Column 1 | Column 2 | Column 3 | Column 4 | Column 5 | Total | |
| Row 1 | 73 | 255 | 245 | 136 | 138 | 847 |
| Row 2 | 11 | 20 | 33 | 16 | 27 | 107 |
| Total | 84 | 275 | 278 | 152 | 165 | 954 |
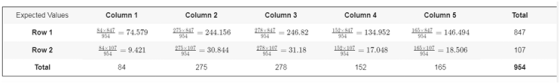


Conclusion
It is concluded that the null hypothesis Ho is not rejected. Therefore, there is enough evidence to claim that the cooperation of the subject response or refusal is independent of age category. at the 0.01 significance level.
Add Answer to:
7. A study of people who refused to answer survey questions
provided the randomly selected sample...
Survey Refusals from study of pear Hear You Knock Methods and Rese randomly selected. Gugals. In...
 Survey Refusals from study of pear Hear You Knock Methods and Rese randomly selected. Gugals. In Exercises 27-32, refer to the following table summarizing results Ju of people who refused to answer survey questions (based on data from Knocking but You Can't Come In," by Fitzgerald and Fuller, Sociological and Research, Vol. 11, No. 1). In each case, assume that one of the subjects is 18-21 22-29 30-39 245 Age 40-49 136 16 60 and over 202 73 255 50-59...
The table below summarizes results from a study of people who refused to answer survey questions.
 The table below summarizes results from a study of people who refused to answer survey questions. A market researcher is not interested in refusals or subjects below 22 years of age or over 59. Find the probability that the selected person refused to answer or is below 22 or is older than 59. The probability that a randomly selected person refused to answer the survey question or is below 22 or is older than 59 is _______ (Do not round until...
In 2012, the General Social Survey asked a random sample of adults, "Compared to most people, how...
 In 2012, the General Social Survey asked a random sample of adults, "Compared to most people, how informed are you about politics?" Suppose that the following are the data classified by their responses to this question and their age group (the data has been modified slightly for testing purposes) Not at Al A Little 30 29 26 59 Extremely Somewhat Very 13 24 25 78 28 Age 20-29 Age 30-39 Age 40-49 Age 50 or older 16 49 20 120...
The information below may be used in several questions A nyada sample of people who reported...
 The information below may be used in several questions A nyada sample of people who reported that they were parents to report the age they were when the first child was born. Researchers want to perform a hypothesis test at the determine the mean age at which men have the fest child is different from women 0.10 level of significance to who Hypothesied Meaning h o n d women Supe rhers wished to rest whether the mean age at which...
In 2012, the General Social Survey asked a random sample of adults, "Compared to most people,...
In 2012, the General Social Survey asked a random sample of adults, "Compared to most people, how informed are you about politics?" Suppose that the following are the data classified by their responses to this question and their age group (the data has been modified slightly for testing purposes): Not at All A Little Somewhat Very Extremely Age 20-29 9 28 28 12 0 Age 30-39 15 28 55 23 8 Age 40-49 2 26 50 26 15 Age 50...
Part 1. Answer the questions below using the scenarios provided 1. You want to investigate whether...
 Part 1. Answer the questions below using the scenarios provided 1. You want to investigate whether there is a difference in hours of sleep between students who work out for many hours and those who work out for a few hours. Yo u get a sample of students and interview them. During the interview, you ask each participant about the number of hours they work out and the number of hours they spend sleeping each week. Each respondent tells you...
Two researchers conducted a study in which two groups of students were asked to answer 42...
 Two researchers conducted a study in which two groups of students were asked to answer 42 trivia questions from a board game. The students in group 1 were asked to spend 5 minutes thinking about what it would mean to be a professor, while the students in group 2 were asked to think about soccer hooligans. These pretest thoughts are a form of priming. The 200 students in group 1 had a mean score of 26.2 with a standard deviation...
Based on information from a previous study, r = 34 people out of a random sample...
 Based on information from a previous study, r = 34 people out of a random sample of n = 101 adult Americans who did not attend college believe in extraterrestrials. However, out of a random sample of n2 = 101 adult Americans who did attend college, '2 = 47 claim that they believe in extraterrestrials. Does this indicate that the proportion of people who attended college and who believe in extraterrestrials is higher than the proportion who did not attend...
6. Pedestrian Deaths A researcher wanted to determinse whether pedestrian deaths were uniformly distributed over the days of the week. She randomly selected 300 pedestrian...
 6. Pedestrian Deaths A researcher wanted to determinse whether pedestrian deaths were uniformly distributed over the days of the week. She randomly selected 300 pedestrian deaths, recorded the day of the week on which the death occurred, and obtained the following results (the data are based on information obtained from the Insurance Institute for Highway Safety) Day of the Week Sunday Monday Tuesday Wednesday Frequency Day of Frequency the Week Thursday Friday Saturday 41 49 61 39 40 30 40...
In a History with multiple (4) choice questions, a correct answer gives one point while there...
In a History with multiple (4) choice questions, a correct answer gives one point while there is a 1/4 of the point penalty for a wrong answer. Having no time to answer the last ten questions, a student decides to mark them randomly. What do you expect? Select one: a. He neither gains nor loses any points b. He loses some points c. He gains some points d. Cannot be answered with the given information If the mean of a...
 Survey Refusals from study of pear Hear You Knock Methods and Rese randomly selected. Gugals. In Exercises 27-32, refer to the following table summarizing results Ju of people who refused to answer survey questions (based on data from Knocking but You Can't Come In," by Fitzgerald and Fuller, Sociological and Research, Vol. 11, No. 1). In each case, assume that one of the subjects is 18-21 22-29 30-39 245 Age 40-49 136 16 60 and over 202 73 255 50-59...
 In 2012, the General Social Survey asked a random sample of adults, "Compared to most people, how informed are you about politics?" Suppose that the following are the data classified by their responses to this question and their age group (the data has been modified slightly for testing purposes) Not at Al A Little 30 29 26 59 Extremely Somewhat Very 13 24 25 78 28 Age 20-29 Age 30-39 Age 40-49 Age 50 or older 16 49 20 120...
 The information below may be used in several questions A nyada sample of people who reported that they were parents to report the age they were when the first child was born. Researchers want to perform a hypothesis test at the determine the mean age at which men have the fest child is different from women 0.10 level of significance to who Hypothesied Meaning h o n d women Supe rhers wished to rest whether the mean age at which...
 Part 1. Answer the questions below using the scenarios provided 1. You want to investigate whether there is a difference in hours of sleep between students who work out for many hours and those who work out for a few hours. Yo u get a sample of students and interview them. During the interview, you ask each participant about the number of hours they work out and the number of hours they spend sleeping each week. Each respondent tells you...
 Two researchers conducted a study in which two groups of students were asked to answer 42 trivia questions from a board game. The students in group 1 were asked to spend 5 minutes thinking about what it would mean to be a professor, while the students in group 2 were asked to think about soccer hooligans. These pretest thoughts are a form of priming. The 200 students in group 1 had a mean score of 26.2 with a standard deviation...
 Based on information from a previous study, r = 34 people out of a random sample of n = 101 adult Americans who did not attend college believe in extraterrestrials. However, out of a random sample of n2 = 101 adult Americans who did attend college, '2 = 47 claim that they believe in extraterrestrials. Does this indicate that the proportion of people who attended college and who believe in extraterrestrials is higher than the proportion who did not attend...
 6. Pedestrian Deaths A researcher wanted to determinse whether pedestrian deaths were uniformly distributed over the days of the week. She randomly selected 300 pedestrian deaths, recorded the day of the week on which the death occurred, and obtained the following results (the data are based on information obtained from the Insurance Institute for Highway Safety) Day of the Week Sunday Monday Tuesday Wednesday Frequency Day of Frequency the Week Thursday Friday Saturday 41 49 61 39 40 30 40...
Most questions answered within 3 hours.
-
Where is the error in this code sequence?
String s1 = "Hello";
String s2 = "ello";...
asked 11 months ago -
Financial data for Joel de Paris, Inc., for last year
follow:
Joel de Paris, Inc.
Balance...
asked 11 months ago -
Consider this reaction:
Al2(SO4)3 (aq)+ BaCl3
(aq) Al2Cl6 (aq)- +
3BaSO4(s) . What is the...
asked 11 months ago -
Suppose that Savneet is considering increasing her
recent random sample from 20 car rentals to 40...
asked 11 months ago -
Trucks arrive at an unloading terminal at an average rate of 120
per hour.
Trucks arrive...
asked 11 months ago -
Why are methanol and ethanol completely soluble in water while
octanol is not very little soluble....
asked 11 months ago -
A facilities manager at a university reads in a research report
that the mean amount of...
asked 11 months ago -
When the CuSO4 is rehydrated by adding water to the anhydrous
compound, is this an endothermic...
asked 11 months ago -
A ray of sunlight is passing from diamond into crown glass; the
angle of incidence is...
asked 11 months ago -
A block of mass 0.249 kg is placed on top of a light, vertical
spring of...
asked 11 months ago -
how do the kidneys compensate in the presences of acidosis
a) trigger hyperventilate
b) reserve acid...
asked 11 months ago -
Question 501 pts
The rental rate of capital to the firm increases. Which of the
following...
asked 11 months ago