STATS Use the R function rnorm() to simulate selecting a random sample of size 25 from...
STATS
Use the R function rnorm() to simulate selecting a random sample of size 25 from a population with mean 80 and s.d. 20. The goal here is to show how contamination affects the mean, s.d., and z-scores.
(a) Obtain the sample mean and sample sd of the simulated sample and use them to obtain the z-score for 100.
(b) Create the vector contam = c(0,seq(1000,10000,length=21)) To show the effects of contamination, separately add each value of contam to the largest value in the simulated data set, and then recompute the sample mean, sd, and z-score of 100 for each of these contaminated samples. This will result in vectors of length 22 that contain the recomputed means, sd's, and z-scores. Note that the first element of each of these vectors will be the corresponding mean, sd, and z-score of the original simulated data. For the following plots use type = "b" so that the points are connected by lines.
(c) Plot the recomputed means versus the values of contam.
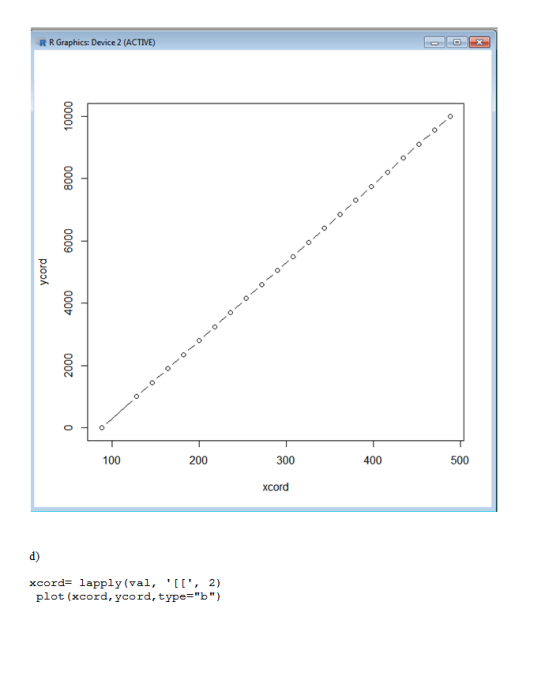
(d) Plot the recomputed s.d.'s versus the values of contam.
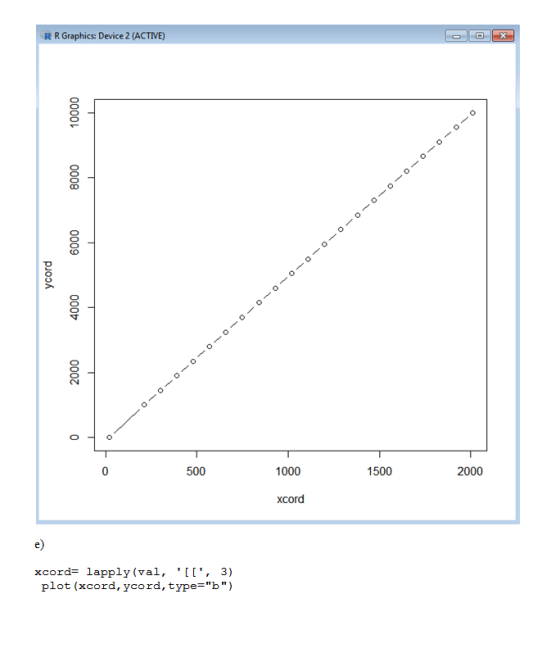
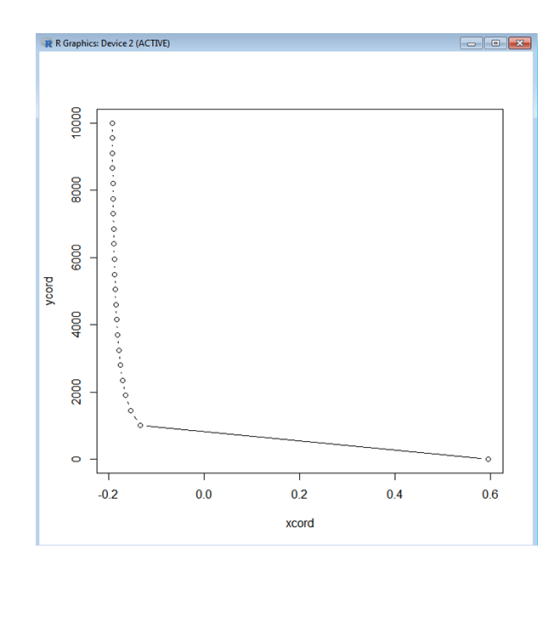
(e) Plot the recomputed z-scores versus the values of contam.
Note: the sorted data can be obtained by
xs = sort(x,decreasing=TRUE)
You need to add each value of contam to the largest value in the sample which is xs[1]. So you will end up with 22 recomputed means, 22 recomputed s.d.'s, and 22 recomputed z-scores. An efficient way to setup this problem is to create a matrix that contains 22 columns each of which is the sorted vector xs.
nc = length(contam)
xmat = matrix(rep(xs,nc),ncol=nc)
Then add contam to the first row of that matrix to obtain the contaminated samples (the first column will be unchanged since the first element of contam is 0). Next use the apply function to obtain column means and sd's.
Homework Answers
![Solution v-rnorm (25, 80,20) >v-rnorm (25, 80,20) [1 60.99525 63.22160 104.05939 68.3377378.09106 72.82478 121.10129 [8] 131.](http://img.homeworklib.com/questions/a10ceac0-6bc4-11eb-8de5-85b1bf1b0fc8.png?x-oss-process=image/resize,w_560)
![val t111 11 88.2580575 19.7266752 0.5952317 t211 [1] 128.2580575 209.8382485 -0.1346659 t1311 11 146.2580575 299.6187870 -0.1](http://img.homeworklib.com/questions/a16d7940-6bc4-11eb-8389-3160caa6fe4e.png?x-oss-process=image/resize,w_560)
![t1181 1 416.2580575 1649.2002068 -0.1917645 t t1911 1 434.2580575 1739.1954028 -0.1921912 t [20] [1] 452.2580575 1829.1910715](http://img.homeworklib.com/questions/a1d399f0-6bc4-11eb-aae2-bb2f68489364.png?x-oss-process=image/resize,w_560)
Executable R Code:
v=rnorm(25,80,20)
a)
m=mean(v)
s=sd(v)
z=(100-m)/s
b)
contam=c(0,seq(1000,10000,length=21))
v1=v
val=list()
for(i in 1:22)
{
k=which.max(v)
v[k]=v[k]+contam[i]
vec=c(mean(v),sd(v),(100-mean(v))/sd(v))
val[[i]]=vec
v=v1
}
xcord= lapply(val, '[[', 1)
ycord=contam
plot(xcord,ycord,type="b")
d)
xcord= lapply(val, '[[', 2)
plot(xcord,ycord,type="b")
e)
xcord= lapply(val, '[[', 3)
plot(xcord,ycord,type="b")
Add Answer to:
STATS
Use the R function rnorm() to simulate selecting a random sample
of size 25 from...
i need help on question 3 to 22 please. Midterm ex review. MATH 101 Use the...
 i need help on question 3 to 22 please.
Midterm ex review. MATH 101 Use the following information to answer the next four exercises. The midterm grades on a chemistry exam, graded on a scale of 0 to 100, were: 62, 64, 65, 65, 68, 70, 72, 72, 74, 75, 75, 75, 76,78, 78, 81, 82, 83, 84, 85, 87, 88, 92, 95, 98, 98, 100, 100,740 1. Do you see any outliers in this data? If so, how would...
i need help on question 3 to 22 please.
Midterm ex review. MATH 101 Use the following information to answer the next four exercises. The midterm grades on a chemistry exam, graded on a scale of 0 to 100, were: 62, 64, 65, 65, 68, 70, 72, 72, 74, 75, 75, 75, 76,78, 78, 81, 82, 83, 84, 85, 87, 88, 92, 95, 98, 98, 100, 100,740 1. Do you see any outliers in this data? If so, how would...
 i need help on question 3 to 22 please.
Midterm ex review. MATH 101 Use the following information to answer the next four exercises. The midterm grades on a chemistry exam, graded on a scale of 0 to 100, were: 62, 64, 65, 65, 68, 70, 72, 72, 74, 75, 75, 75, 76,78, 78, 81, 82, 83, 84, 85, 87, 88, 92, 95, 98, 98, 100, 100,740 1. Do you see any outliers in this data? If so, how would...
i need help on question 3 to 22 please.
Midterm ex review. MATH 101 Use the following information to answer the next four exercises. The midterm grades on a chemistry exam, graded on a scale of 0 to 100, were: 62, 64, 65, 65, 68, 70, 72, 72, 74, 75, 75, 75, 76,78, 78, 81, 82, 83, 84, 85, 87, 88, 92, 95, 98, 98, 100, 100,740 1. Do you see any outliers in this data? If so, how would...
Most questions answered within 3 hours.
-
Where is the error in this code sequence?
String s1 = "Hello";
String s2 = "ello";...
asked 11 months ago -
Financial data for Joel de Paris, Inc., for last year
follow:
Joel de Paris, Inc.
Balance...
asked 11 months ago -
Consider this reaction:
Al2(SO4)3 (aq)+ BaCl3
(aq) Al2Cl6 (aq)- +
3BaSO4(s) . What is the...
asked 11 months ago -
Suppose that Savneet is considering increasing her
recent random sample from 20 car rentals to 40...
asked 11 months ago -
Trucks arrive at an unloading terminal at an average rate of 120
per hour.
Trucks arrive...
asked 11 months ago -
Why are methanol and ethanol completely soluble in water while
octanol is not very little soluble....
asked 11 months ago -
A facilities manager at a university reads in a research report
that the mean amount of...
asked 11 months ago -
When the CuSO4 is rehydrated by adding water to the anhydrous
compound, is this an endothermic...
asked 11 months ago -
A ray of sunlight is passing from diamond into crown glass; the
angle of incidence is...
asked 11 months ago -
A block of mass 0.249 kg is placed on top of a light, vertical
spring of...
asked 11 months ago -
how do the kidneys compensate in the presences of acidosis
a) trigger hyperventilate
b) reserve acid...
asked 11 months ago -
Question 501 pts
The rental rate of capital to the firm increases. Which of the
following...
asked 11 months ago