
Homework Answers
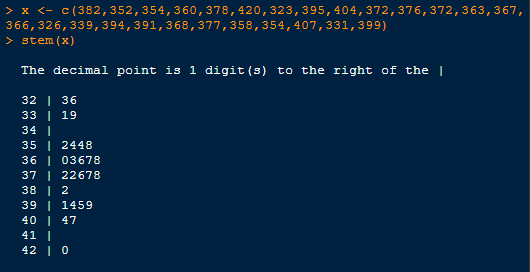
(D) The display is reasonably symmetric, so the mean and median will be close.
Hope this was helpful. Please leave back any comment.
Add Answer to:
A sample of 26 offshore oil workers took part in a simulated escape exercise, resulting in...
A sample of 26 offshore oil workers took part in a simulated escape exercise, resulting in...
 A sample of 26 offshore oil workers took part in a simulated escape exercise, resulting in the accompanying data on time (sec) to complete the escape 388 350 354 361 379 423 322 395 402 373 375 372 362 367 365 327 335 393 392 368 377 357 352 405 333 399 (a) Construct a stem-and-leaf display of the data. (Enter numbers from smallest to largest separated by spaces. Enter NONE for stems with no values.) Stems Leaves 32 34...
A sample of 26 offshore oil workers took part in a simulated escape exercise, resulting in...
 A sample of 26 offshore oil workers took part in a simulated escape exercise, resulting in the accompanying data on time (sec) to complete the escape: 383 351 355 361 378 421 321 396 404 372 376 370 364 367 364 327 338395 393 369 378 357 353 406 333 399 (a) Construct a stem-and-leaf display of the data. (Enter numbers from smallest to largest separated by spaces. Enter NONE for stems with no values.) Stems Leaves 32 35 37...
Will rate!! A sample of 26 offshore oil workers took part in a simulated escape exercise,...
 Will rate!!
A sample of 26 offshore oil workers took part in a simulated escape exercise, resulting in the accompanying data on time (sec) to complete the escape: # Use R to create a stemplot # Copy the data and code below #Run the code in R time-c 388, 351, 356, 362, 379, 425, 321, 397, 401, 372, 375, 371, 362, 368, 366, 326, 335, 393, 390, 368, 377, 357, 353, 406, 330, 397) stem(time, 1) # Note: If your...
Will rate!!
A sample of 26 offshore oil workers took part in a simulated escape exercise, resulting in the accompanying data on time (sec) to complete the escape: # Use R to create a stemplot # Copy the data and code below #Run the code in R time-c 388, 351, 356, 362, 379, 425, 321, 397, 401, 372, 375, 371, 362, 368, 366, 326, 335, 393, 390, 368, 377, 357, 353, 406, 330, 397) stem(time, 1) # Note: If your...
Wii rate!! A sample of 26 offshore oil workers took part in a simulated escape exercise,...
 Wii
rate!!
A sample of 26 offshore oil workers took part in a simulated escape exercise, resulting in the accompanying data on time (sec) to complete the escape: # Use R to create a stemplot # Copy the data and code below # Run the code in R time-c38, 351, 356, 362, 379, 425, 321, 397, 401, 372, 375, 371, 362, 368, 366, 326, 335, 393, 390, 368, 377, 35, 353, 406, 330, 397) stem(time, 1) # Note: If your...
Wii
rate!!
A sample of 26 offshore oil workers took part in a simulated escape exercise, resulting in the accompanying data on time (sec) to complete the escape: # Use R to create a stemplot # Copy the data and code below # Run the code in R time-c38, 351, 356, 362, 379, 425, 321, 397, 401, 372, 375, 371, 362, 368, 366, 326, 335, 393, 390, 368, 377, 35, 353, 406, 330, 397) stem(time, 1) # Note: If your...
A sample of 26 offshore oil workers took part in a simu- lated escape exercise, resulting...
 A sample of 26 offshore oil workers took part in a simu- lated escape exercise, resulting in the accompanying data on time (sec) to complete the escape "Oxygen Consumption and Ventilation During Escape from an Offshore Platform," Ergonomics, 1997: 281-292): 36. 389 356 359 363 375 424 325 394 402 373 373 370 364 366 364 325 339 393 392 369 374 359 356 403 334 397 a. Construct a stem-and-leaf display of the data. How does it suggest that...
A sample of 26 offshore oil workers took part in a simulated escape exercise, resulting in...
A sample of 26 offshore oil workers took part in a simulated escape exercise, resulting in the accompanying data on time (sec) to complete the escape. 389 356 359 363 375 425 325 394 403 373 374 371 364 366 364 325 339 394 393 369 375 359 356 404 334 398 A normal probability plot of the n = 26 observations on escape time given above shows a substantial linear pattern; the sample mean and sample standard deviation are...
A sample of 26 offshore oil workers took part in a simulated escape exercise, resulting in...
 A sample of 26 offshore oil workers took part in a simulated escape exercise, resulting in the accompanying data on time (sec) to complete the escape. 389 374 393 356 359 363 374 370 365 369 374 359 375 366 357 425 325 365 326 404 335 395 403 339 393 398 A normal probability plot of the n = 26 observations on escape time given above shows a substantial linear pattern; the sample mean and sample standard deviation are...
A sample of 26 offshore oil workers took part in a simulated escape exercise, resulting in...
 A sample of 26 offshore oil workers took part in a simulated escape exercise, resulting in the accompanying data on time (sec) to complete the escape. 389 356 359 364 375 424 326 395 403 373 374 370 365 367 364 325 339 394 392 369 375 359 356 403 334 397 A normal probability plot of the n = 26 observations on escape time given above shows a substantial linear pattern; the sample mean and sample standard deviation are...
########################################################################################## # Use...
 ##########################################################################################
# Use R to create a stemplot
# Copy the data and code below
# Run the code in R
time=c(
383,
350,
354,
360,
379,
421,
321,
396,
403,
372,
375,
372,
363,
368,
365,
328,
336,
395,
390,
369,
378,
359,
352,
409,
334,
399)
stem(time,1)
#Note: If your stems from R are not the same as below. Change 1
in the stem function to 2.
##########################################################################################
code if needed
A sample of 26 offshore oil workers...
##########################################################################################
# Use R to create a stemplot
# Copy the data and code below
# Run the code in R
time=c(
383,
350,
354,
360,
379,
421,
321,
396,
403,
372,
375,
372,
363,
368,
365,
328,
336,
395,
390,
369,
378,
359,
352,
409,
334,
399)
stem(time,1)
#Note: If your stems from R are not the same as below. Change 1
in the stem function to 2.
##########################################################################################
code if needed
A sample of 26 offshore oil workers...
A sample of 26 offshore oil workers took part in a simulated escape exercise, resulting in the accompanying data on time (sec) to complete the escape. 389 356 359 363 376 425 325 395 403 374 374 370...
 A sample of 26 offshore oil workers took part in a simulated escape exercise, resulting in the accompanying data on time (sec) to complete the escape. 389 356 359 363 376 425 325 395 403 374 374 370 365 367 364 326 339 394 392 369 375 359 356 403 334 398 A normal probability plot of the n 26 observations on escape time given above shows a substantial linear pattern; the sample mean and sample standard deviation are 371.15...
 A sample of 26 offshore oil workers took part in a simulated escape exercise, resulting in the accompanying data on time (sec) to complete the escape 388 350 354 361 379 423 322 395 402 373 375 372 362 367 365 327 335 393 392 368 377 357 352 405 333 399 (a) Construct a stem-and-leaf display of the data. (Enter numbers from smallest to largest separated by spaces. Enter NONE for stems with no values.) Stems Leaves 32 34...
 A sample of 26 offshore oil workers took part in a simulated escape exercise, resulting in the accompanying data on time (sec) to complete the escape: 383 351 355 361 378 421 321 396 404 372 376 370 364 367 364 327 338395 393 369 378 357 353 406 333 399 (a) Construct a stem-and-leaf display of the data. (Enter numbers from smallest to largest separated by spaces. Enter NONE for stems with no values.) Stems Leaves 32 35 37...
 Will rate!!
A sample of 26 offshore oil workers took part in a simulated escape exercise, resulting in the accompanying data on time (sec) to complete the escape: # Use R to create a stemplot # Copy the data and code below #Run the code in R time-c 388, 351, 356, 362, 379, 425, 321, 397, 401, 372, 375, 371, 362, 368, 366, 326, 335, 393, 390, 368, 377, 357, 353, 406, 330, 397) stem(time, 1) # Note: If your...
Will rate!!
A sample of 26 offshore oil workers took part in a simulated escape exercise, resulting in the accompanying data on time (sec) to complete the escape: # Use R to create a stemplot # Copy the data and code below #Run the code in R time-c 388, 351, 356, 362, 379, 425, 321, 397, 401, 372, 375, 371, 362, 368, 366, 326, 335, 393, 390, 368, 377, 357, 353, 406, 330, 397) stem(time, 1) # Note: If your...
 Wii
rate!!
A sample of 26 offshore oil workers took part in a simulated escape exercise, resulting in the accompanying data on time (sec) to complete the escape: # Use R to create a stemplot # Copy the data and code below # Run the code in R time-c38, 351, 356, 362, 379, 425, 321, 397, 401, 372, 375, 371, 362, 368, 366, 326, 335, 393, 390, 368, 377, 35, 353, 406, 330, 397) stem(time, 1) # Note: If your...
Wii
rate!!
A sample of 26 offshore oil workers took part in a simulated escape exercise, resulting in the accompanying data on time (sec) to complete the escape: # Use R to create a stemplot # Copy the data and code below # Run the code in R time-c38, 351, 356, 362, 379, 425, 321, 397, 401, 372, 375, 371, 362, 368, 366, 326, 335, 393, 390, 368, 377, 35, 353, 406, 330, 397) stem(time, 1) # Note: If your...
 A sample of 26 offshore oil workers took part in a simu- lated escape exercise, resulting in the accompanying data on time (sec) to complete the escape "Oxygen Consumption and Ventilation During Escape from an Offshore Platform," Ergonomics, 1997: 281-292): 36. 389 356 359 363 375 424 325 394 402 373 373 370 364 366 364 325 339 393 392 369 374 359 356 403 334 397 a. Construct a stem-and-leaf display of the data. How does it suggest that...
 A sample of 26 offshore oil workers took part in a simulated escape exercise, resulting in the accompanying data on time (sec) to complete the escape. 389 374 393 356 359 363 374 370 365 369 374 359 375 366 357 425 325 365 326 404 335 395 403 339 393 398 A normal probability plot of the n = 26 observations on escape time given above shows a substantial linear pattern; the sample mean and sample standard deviation are...
 A sample of 26 offshore oil workers took part in a simulated escape exercise, resulting in the accompanying data on time (sec) to complete the escape. 389 356 359 364 375 424 326 395 403 373 374 370 365 367 364 325 339 394 392 369 375 359 356 403 334 397 A normal probability plot of the n = 26 observations on escape time given above shows a substantial linear pattern; the sample mean and sample standard deviation are...
 ##########################################################################################
# Use R to create a stemplot
# Copy the data and code below
# Run the code in R
time=c(
383,
350,
354,
360,
379,
421,
321,
396,
403,
372,
375,
372,
363,
368,
365,
328,
336,
395,
390,
369,
378,
359,
352,
409,
334,
399)
stem(time,1)
#Note: If your stems from R are not the same as below. Change 1
in the stem function to 2.
##########################################################################################
code if needed
A sample of 26 offshore oil workers...
##########################################################################################
# Use R to create a stemplot
# Copy the data and code below
# Run the code in R
time=c(
383,
350,
354,
360,
379,
421,
321,
396,
403,
372,
375,
372,
363,
368,
365,
328,
336,
395,
390,
369,
378,
359,
352,
409,
334,
399)
stem(time,1)
#Note: If your stems from R are not the same as below. Change 1
in the stem function to 2.
##########################################################################################
code if needed
A sample of 26 offshore oil workers...
 A sample of 26 offshore oil workers took part in a simulated escape exercise, resulting in the accompanying data on time (sec) to complete the escape. 389 356 359 363 376 425 325 395 403 374 374 370 365 367 364 326 339 394 392 369 375 359 356 403 334 398 A normal probability plot of the n 26 observations on escape time given above shows a substantial linear pattern; the sample mean and sample standard deviation are 371.15...
Most questions answered within 3 hours.
-
Where is the error in this code sequence?
String s1 = "Hello";
String s2 = "ello";...
asked 11 months ago -
Financial data for Joel de Paris, Inc., for last year
follow:
Joel de Paris, Inc.
Balance...
asked 11 months ago -
Consider this reaction:
Al2(SO4)3 (aq)+ BaCl3
(aq) Al2Cl6 (aq)- +
3BaSO4(s) . What is the...
asked 11 months ago -
Suppose that Savneet is considering increasing her
recent random sample from 20 car rentals to 40...
asked 11 months ago -
Trucks arrive at an unloading terminal at an average rate of 120
per hour.
Trucks arrive...
asked 11 months ago -
Why are methanol and ethanol completely soluble in water while
octanol is not very little soluble....
asked 11 months ago -
A facilities manager at a university reads in a research report
that the mean amount of...
asked 11 months ago -
When the CuSO4 is rehydrated by adding water to the anhydrous
compound, is this an endothermic...
asked 11 months ago -
A ray of sunlight is passing from diamond into crown glass; the
angle of incidence is...
asked 11 months ago -
A block of mass 0.249 kg is placed on top of a light, vertical
spring of...
asked 11 months ago -
how do the kidneys compensate in the presences of acidosis
a) trigger hyperventilate
b) reserve acid...
asked 11 months ago -
Question 501 pts
The rental rate of capital to the firm increases. Which of the
following...
asked 11 months ago