
Please help me find the peaks that are associated with the molecules in these 2 IR's. Thank you!
Homework Answers
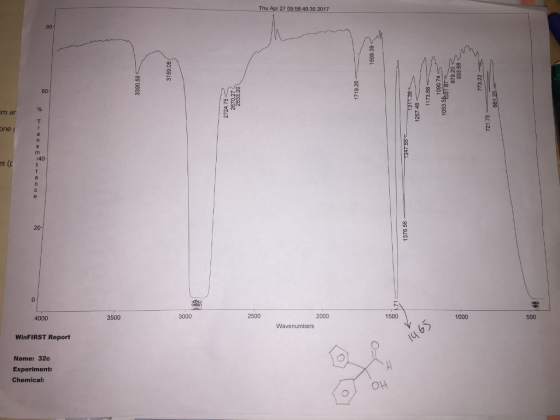
in sprectrum 1) the broad pek at aroun 3000 is pek of OH stechinh frequency
aldehyde carbonyl came at 1719 aldehyde Ch came at 2724
1465 is C-O strech of alcohol
in specrtm 2)brod peak of OH at aound 300 cm-
1668 is prek of carbonyl
1400 is peak of co steching of alcohol
and stecing at 1376
Add Answer to:
Please help me find the peaks that are associated with the
molecules in these 2 IR's....
Label all peaks of this IR spectrum. Please help me. 3500 3000 2961.48 2869.66 2500 Wavenumbers...
 Label all peaks of this IR spectrum. Please help
me.
3500 3000 2961.48 2869.66 2500 Wavenumbers (cm-1) 2000 1745.65 1500 1387.86 1368.87 1229.55 1000 500 Infrared Peak (cm) Structural Assignment
Label all peaks of this IR spectrum. Please help
me.
3500 3000 2961.48 2869.66 2500 Wavenumbers (cm-1) 2000 1745.65 1500 1387.86 1368.87 1229.55 1000 500 Infrared Peak (cm) Structural Assignment
Please evaluate the IR spectrum. Provide a structure and note any important peaks corresponding to the structure. It was an experiment using: isoamyl alcohol + acetic acid sulfuric acid as the catalys...
 Please evaluate the IR spectrum. Provide a structure and note
any important peaks corresponding to the structure.
It was an experiment using:
isoamyl alcohol + acetic acid
sulfuric acid as the catalyst
and the products are isoamyl acetate and water. Thank you so
much!!!
95 卜诒 卜” 90 85 寸 80 75 70 65 E 60 ー 55 50 45 40 35 30 25 20 4000 3500 3000 2500 2000 Wavenumbers (cm-1) 1500 1000 500
95 卜诒 卜” 90 85...
Please evaluate the IR spectrum. Provide a structure and note
any important peaks corresponding to the structure.
It was an experiment using:
isoamyl alcohol + acetic acid
sulfuric acid as the catalyst
and the products are isoamyl acetate and water. Thank you so
much!!!
95 卜诒 卜” 90 85 寸 80 75 70 65 E 60 ー 55 50 45 40 35 30 25 20 4000 3500 3000 2500 2000 Wavenumbers (cm-1) 1500 1000 500
95 卜诒 卜” 90 85...
May someone help me label all peaks of this IR spectrum. 3500 3000 2961.48 2869.66 2500...
 May someone help me label all peaks of this IR
spectrum.
3500 3000 2961.48 2869.66 2500 Wavenumbers (cm-1) 2000 1745.65 1500 1387.86 1368.87 1229.55 1000 500 Infrared Peak (cm) Structural Assignment
May someone help me label all peaks of this IR
spectrum.
3500 3000 2961.48 2869.66 2500 Wavenumbers (cm-1) 2000 1745.65 1500 1387.86 1368.87 1229.55 1000 500 Infrared Peak (cm) Structural Assignment
IR help please help identify unknown compound with the given peaks. For Organic Chemsitry 80 Ned...
 IR help please help identify unknown compound with the given
peaks.
For Organic Chemsitry
80 Ned Jan 21 16 38 59 2015 (GMT-08 00) 4000 3500 3000 2500 2000 1500 1000 Wavenumbers (cm-1) Wed Jan 21 16.57:29 2015 (GMT-08.00) FIND PEAKS Wed Jan 21 16:38:59 2015 (GMT-08.00) 4000.00 65743 Region Absolute threshold: 45.147 50 Peak list Position: 1033.92 Intensity 44.929 Position:1096.89 Intensity 45050 Position:1120.72 Intensity 44290 Position: 1189.29 Intensity 39.970 Position 1295.73 Intensity 42.669 Position: 1370.83 Intensity: 43.378 Position: 1735.90...
IR help please help identify unknown compound with the given
peaks.
For Organic Chemsitry
80 Ned Jan 21 16 38 59 2015 (GMT-08 00) 4000 3500 3000 2500 2000 1500 1000 Wavenumbers (cm-1) Wed Jan 21 16.57:29 2015 (GMT-08.00) FIND PEAKS Wed Jan 21 16:38:59 2015 (GMT-08.00) 4000.00 65743 Region Absolute threshold: 45.147 50 Peak list Position: 1033.92 Intensity 44.929 Position:1096.89 Intensity 45050 Position:1120.72 Intensity 44290 Position: 1189.29 Intensity 39.970 Position 1295.73 Intensity 42.669 Position: 1370.83 Intensity: 43.378 Position: 1735.90...
please label the peaks this is citral im trying to assess the purity please help thanks!...
 please label the peaks this is citral im trying to assess the
purity please help thanks!
PerkinElmer Spectrum Vers. Tuesday, November 05, 2015 Analyst Date Administrator Tuesday, November 05, 2019 1:59 PM % T 2500 550 3500 3000 2000 1500 1000 cm-1 Administrator 613 Sample 613 By Administrator Date Tuesday, November 05 2019
please label the peaks this is citral im trying to assess the
purity please help thanks!
PerkinElmer Spectrum Vers. Tuesday, November 05, 2015 Analyst Date Administrator Tuesday, November 05, 2019 1:59 PM % T 2500 550 3500 3000 2000 1500 1000 cm-1 Administrator 613 Sample 613 By Administrator Date Tuesday, November 05 2019
this is the IR spectra for 2-naphthol. can someone please analyze it and identify the most...
 this is the IR spectra for 2-naphthol. can someone please
analyze it and identify the most important peaks that identify the
compound. thank you!
%Transmittance 4000 Mon det 28 3500 61:52 2019 (GMT-04:00) 3253.32 3000 3052.13 2555.11 2500 Wavenumbers (cm-1) 2000 1680.84 1628.41 1599.64 1582.13 1500 1508.24 1464.59 1452.42 - 1273.49 1240.61 1214.58 1406.04 1378.351323.47 1362.31 1000 1171,58 1138.27 1127.67 1117.5672.39 1026.32 1013.75 957.71 933 24 842.17904.74877.72 811.56 768.67.751.65 740.24 683.33 666.32 638 95 11 11
this is the IR spectra for 2-naphthol. can someone please
analyze it and identify the most important peaks that identify the
compound. thank you!
%Transmittance 4000 Mon det 28 3500 61:52 2019 (GMT-04:00) 3253.32 3000 3052.13 2555.11 2500 Wavenumbers (cm-1) 2000 1680.84 1628.41 1599.64 1582.13 1500 1508.24 1464.59 1452.42 - 1273.49 1240.61 1214.58 1406.04 1378.351323.47 1362.31 1000 1171,58 1138.27 1127.67 1117.5672.39 1026.32 1013.75 957.71 933 24 842.17904.74877.72 811.56 768.67.751.65 740.24 683.33 666.32 638 95 11 11
Please label all important peaks on the IR Spectra. 92 90 88 86 84 82 80 78 76- 74: 72 70 68 66 64- 62 60 4000 3500 250...
 Please label all important peaks on the IR Spectra.
92 90 88 86 84 82 80 78 76- 74: 72 70 68 66 64- 62 60 4000 3500 2500 2000 3000 1500 1000 Wavenumbers (cm-1) Date: Thu Nov 07 13:57:45 2019 (GMT-05:0Thu Nov 07 13:54:54 2019 (GMT-05:00) Scans: 32 %Transmittance
Please label all important peaks on the IR Spectra.
92 90 88 86 84 82 80 78 76- 74: 72 70 68 66 64- 62 60 4000 3500 2500 2000 3000 1500 1000 Wavenumbers (cm-1) Date: Thu Nov 07 13:57:45 2019 (GMT-05:0Thu Nov 07 13:54:54 2019 (GMT-05:00) Scans: 32 %Transmittance
Can you help me find what the peaks are? I found some but there are some...
 Can you help me find what the
peaks are? I found some but there are some im not sure about.
1493.16 2952.27 1717.03 1271.67 108.7 16.97 686.75 1601.35 965,49 822.68 1452.po 191.59 31 1434.75" 1315.14 1176.17 %T 1070228.50 674,75 70587 0.0 4000.0 3000 2000 1500 1000 650.0 cm-1
Can you help me find what the
peaks are? I found some but there are some im not sure about.
1493.16 2952.27 1717.03 1271.67 108.7 16.97 686.75 1601.35 965,49 822.68 1452.po 191.59 31 1434.75" 1315.14 1176.17 %T 1070228.50 674,75 70587 0.0 4000.0 3000 2000 1500 1000 650.0 cm-1
Find the IR spectroscopy peaks of 2-Chloro-2-methylbutane. Wed Oct 30 18 28:54 2019 (GMT-07.00) 70- 60-...
 Find the IR spectroscopy peaks of
2-Chloro-2-methylbutane.
Wed Oct 30 18 28:54 2019 (GMT-07.00) 70- 60- 50- 40 30- 20- 10 0- 10 3500 4000 3000 2500 2000 1500 1000 500 Wavenumbers (em-1) %Transmittance 2935.33 98'E88 2737.20 1459.46 1380.4370.23 1344.16 1288.77 FOOEZL 11484112257 1061,02 95 9001 918.25 798.77 773.16 617.01 89 999 LL999
Find the IR spectroscopy peaks of
2-Chloro-2-methylbutane.
Wed Oct 30 18 28:54 2019 (GMT-07.00) 70- 60- 50- 40 30- 20- 10 0- 10 3500 4000 3000 2500 2000 1500 1000 500 Wavenumbers (em-1) %Transmittance 2935.33 98'E88 2737.20 1459.46 1380.4370.23 1344.16 1288.77 FOOEZL 11484112257 1061,02 95 9001 918.25 798.77 773.16 617.01 89 999 LL999
Unknown 315-S20-2 Can someone help me fill out the table on the right side please IR...
 Unknown 315-S20-2
Can someone help me fill out the table on the right side
please
IR Spectrum:
Unknown # 315-S20-2 Mol. Wt. = 181.0 g/mol C-33.17% H=5.01% 0 = 17.68% Molecular Formula Degree of Unsaturation = Mass Spectrum IR spectrum (liquid film) 100- Relative Intensity 150 175 25 50 75 100 125 m/z Based on the M.W., circle & label the molecular ion peak (M). Spectrum Region Frequency (cm ) Peak Shape (sharp, broad) MAVUTO Peak Intensity (strong, med., weak)...
Unknown 315-S20-2
Can someone help me fill out the table on the right side
please
IR Spectrum:
Unknown # 315-S20-2 Mol. Wt. = 181.0 g/mol C-33.17% H=5.01% 0 = 17.68% Molecular Formula Degree of Unsaturation = Mass Spectrum IR spectrum (liquid film) 100- Relative Intensity 150 175 25 50 75 100 125 m/z Based on the M.W., circle & label the molecular ion peak (M). Spectrum Region Frequency (cm ) Peak Shape (sharp, broad) MAVUTO Peak Intensity (strong, med., weak)...
 Label all peaks of this IR spectrum. Please help
me.
3500 3000 2961.48 2869.66 2500 Wavenumbers (cm-1) 2000 1745.65 1500 1387.86 1368.87 1229.55 1000 500 Infrared Peak (cm) Structural Assignment
Label all peaks of this IR spectrum. Please help
me.
3500 3000 2961.48 2869.66 2500 Wavenumbers (cm-1) 2000 1745.65 1500 1387.86 1368.87 1229.55 1000 500 Infrared Peak (cm) Structural Assignment
 Please evaluate the IR spectrum. Provide a structure and note
any important peaks corresponding to the structure.
It was an experiment using:
isoamyl alcohol + acetic acid
sulfuric acid as the catalyst
and the products are isoamyl acetate and water. Thank you so
much!!!
95 卜诒 卜” 90 85 寸 80 75 70 65 E 60 ー 55 50 45 40 35 30 25 20 4000 3500 3000 2500 2000 Wavenumbers (cm-1) 1500 1000 500
95 卜诒 卜” 90 85...
Please evaluate the IR spectrum. Provide a structure and note
any important peaks corresponding to the structure.
It was an experiment using:
isoamyl alcohol + acetic acid
sulfuric acid as the catalyst
and the products are isoamyl acetate and water. Thank you so
much!!!
95 卜诒 卜” 90 85 寸 80 75 70 65 E 60 ー 55 50 45 40 35 30 25 20 4000 3500 3000 2500 2000 Wavenumbers (cm-1) 1500 1000 500
95 卜诒 卜” 90 85...
 May someone help me label all peaks of this IR
spectrum.
3500 3000 2961.48 2869.66 2500 Wavenumbers (cm-1) 2000 1745.65 1500 1387.86 1368.87 1229.55 1000 500 Infrared Peak (cm) Structural Assignment
May someone help me label all peaks of this IR
spectrum.
3500 3000 2961.48 2869.66 2500 Wavenumbers (cm-1) 2000 1745.65 1500 1387.86 1368.87 1229.55 1000 500 Infrared Peak (cm) Structural Assignment
 IR help please help identify unknown compound with the given
peaks.
For Organic Chemsitry
80 Ned Jan 21 16 38 59 2015 (GMT-08 00) 4000 3500 3000 2500 2000 1500 1000 Wavenumbers (cm-1) Wed Jan 21 16.57:29 2015 (GMT-08.00) FIND PEAKS Wed Jan 21 16:38:59 2015 (GMT-08.00) 4000.00 65743 Region Absolute threshold: 45.147 50 Peak list Position: 1033.92 Intensity 44.929 Position:1096.89 Intensity 45050 Position:1120.72 Intensity 44290 Position: 1189.29 Intensity 39.970 Position 1295.73 Intensity 42.669 Position: 1370.83 Intensity: 43.378 Position: 1735.90...
IR help please help identify unknown compound with the given
peaks.
For Organic Chemsitry
80 Ned Jan 21 16 38 59 2015 (GMT-08 00) 4000 3500 3000 2500 2000 1500 1000 Wavenumbers (cm-1) Wed Jan 21 16.57:29 2015 (GMT-08.00) FIND PEAKS Wed Jan 21 16:38:59 2015 (GMT-08.00) 4000.00 65743 Region Absolute threshold: 45.147 50 Peak list Position: 1033.92 Intensity 44.929 Position:1096.89 Intensity 45050 Position:1120.72 Intensity 44290 Position: 1189.29 Intensity 39.970 Position 1295.73 Intensity 42.669 Position: 1370.83 Intensity: 43.378 Position: 1735.90...
 please label the peaks this is citral im trying to assess the
purity please help thanks!
PerkinElmer Spectrum Vers. Tuesday, November 05, 2015 Analyst Date Administrator Tuesday, November 05, 2019 1:59 PM % T 2500 550 3500 3000 2000 1500 1000 cm-1 Administrator 613 Sample 613 By Administrator Date Tuesday, November 05 2019
please label the peaks this is citral im trying to assess the
purity please help thanks!
PerkinElmer Spectrum Vers. Tuesday, November 05, 2015 Analyst Date Administrator Tuesday, November 05, 2019 1:59 PM % T 2500 550 3500 3000 2000 1500 1000 cm-1 Administrator 613 Sample 613 By Administrator Date Tuesday, November 05 2019
 this is the IR spectra for 2-naphthol. can someone please
analyze it and identify the most important peaks that identify the
compound. thank you!
%Transmittance 4000 Mon det 28 3500 61:52 2019 (GMT-04:00) 3253.32 3000 3052.13 2555.11 2500 Wavenumbers (cm-1) 2000 1680.84 1628.41 1599.64 1582.13 1500 1508.24 1464.59 1452.42 - 1273.49 1240.61 1214.58 1406.04 1378.351323.47 1362.31 1000 1171,58 1138.27 1127.67 1117.5672.39 1026.32 1013.75 957.71 933 24 842.17904.74877.72 811.56 768.67.751.65 740.24 683.33 666.32 638 95 11 11
this is the IR spectra for 2-naphthol. can someone please
analyze it and identify the most important peaks that identify the
compound. thank you!
%Transmittance 4000 Mon det 28 3500 61:52 2019 (GMT-04:00) 3253.32 3000 3052.13 2555.11 2500 Wavenumbers (cm-1) 2000 1680.84 1628.41 1599.64 1582.13 1500 1508.24 1464.59 1452.42 - 1273.49 1240.61 1214.58 1406.04 1378.351323.47 1362.31 1000 1171,58 1138.27 1127.67 1117.5672.39 1026.32 1013.75 957.71 933 24 842.17904.74877.72 811.56 768.67.751.65 740.24 683.33 666.32 638 95 11 11
 Please label all important peaks on the IR Spectra.
92 90 88 86 84 82 80 78 76- 74: 72 70 68 66 64- 62 60 4000 3500 2500 2000 3000 1500 1000 Wavenumbers (cm-1) Date: Thu Nov 07 13:57:45 2019 (GMT-05:0Thu Nov 07 13:54:54 2019 (GMT-05:00) Scans: 32 %Transmittance
Please label all important peaks on the IR Spectra.
92 90 88 86 84 82 80 78 76- 74: 72 70 68 66 64- 62 60 4000 3500 2500 2000 3000 1500 1000 Wavenumbers (cm-1) Date: Thu Nov 07 13:57:45 2019 (GMT-05:0Thu Nov 07 13:54:54 2019 (GMT-05:00) Scans: 32 %Transmittance
 Can you help me find what the
peaks are? I found some but there are some im not sure about.
1493.16 2952.27 1717.03 1271.67 108.7 16.97 686.75 1601.35 965,49 822.68 1452.po 191.59 31 1434.75" 1315.14 1176.17 %T 1070228.50 674,75 70587 0.0 4000.0 3000 2000 1500 1000 650.0 cm-1
Can you help me find what the
peaks are? I found some but there are some im not sure about.
1493.16 2952.27 1717.03 1271.67 108.7 16.97 686.75 1601.35 965,49 822.68 1452.po 191.59 31 1434.75" 1315.14 1176.17 %T 1070228.50 674,75 70587 0.0 4000.0 3000 2000 1500 1000 650.0 cm-1
 Find the IR spectroscopy peaks of
2-Chloro-2-methylbutane.
Wed Oct 30 18 28:54 2019 (GMT-07.00) 70- 60- 50- 40 30- 20- 10 0- 10 3500 4000 3000 2500 2000 1500 1000 500 Wavenumbers (em-1) %Transmittance 2935.33 98'E88 2737.20 1459.46 1380.4370.23 1344.16 1288.77 FOOEZL 11484112257 1061,02 95 9001 918.25 798.77 773.16 617.01 89 999 LL999
Find the IR spectroscopy peaks of
2-Chloro-2-methylbutane.
Wed Oct 30 18 28:54 2019 (GMT-07.00) 70- 60- 50- 40 30- 20- 10 0- 10 3500 4000 3000 2500 2000 1500 1000 500 Wavenumbers (em-1) %Transmittance 2935.33 98'E88 2737.20 1459.46 1380.4370.23 1344.16 1288.77 FOOEZL 11484112257 1061,02 95 9001 918.25 798.77 773.16 617.01 89 999 LL999
 Unknown 315-S20-2
Can someone help me fill out the table on the right side
please
IR Spectrum:
Unknown # 315-S20-2 Mol. Wt. = 181.0 g/mol C-33.17% H=5.01% 0 = 17.68% Molecular Formula Degree of Unsaturation = Mass Spectrum IR spectrum (liquid film) 100- Relative Intensity 150 175 25 50 75 100 125 m/z Based on the M.W., circle & label the molecular ion peak (M). Spectrum Region Frequency (cm ) Peak Shape (sharp, broad) MAVUTO Peak Intensity (strong, med., weak)...
Unknown 315-S20-2
Can someone help me fill out the table on the right side
please
IR Spectrum:
Unknown # 315-S20-2 Mol. Wt. = 181.0 g/mol C-33.17% H=5.01% 0 = 17.68% Molecular Formula Degree of Unsaturation = Mass Spectrum IR spectrum (liquid film) 100- Relative Intensity 150 175 25 50 75 100 125 m/z Based on the M.W., circle & label the molecular ion peak (M). Spectrum Region Frequency (cm ) Peak Shape (sharp, broad) MAVUTO Peak Intensity (strong, med., weak)...
Most questions answered within 3 hours.
-
Where is the error in this code sequence?
String s1 = "Hello";
String s2 = "ello";...
asked 10 months ago -
Financial data for Joel de Paris, Inc., for last year
follow:
Joel de Paris, Inc.
Balance...
asked 10 months ago -
Consider this reaction:
Al2(SO4)3 (aq)+ BaCl3
(aq) Al2Cl6 (aq)- +
3BaSO4(s) . What is the...
asked 10 months ago -
Suppose that Savneet is considering increasing her
recent random sample from 20 car rentals to 40...
asked 10 months ago -
Trucks arrive at an unloading terminal at an average rate of 120
per hour.
Trucks arrive...
asked 10 months ago -
Why are methanol and ethanol completely soluble in water while
octanol is not very little soluble....
asked 10 months ago -
A facilities manager at a university reads in a research report
that the mean amount of...
asked 10 months ago -
When the CuSO4 is rehydrated by adding water to the anhydrous
compound, is this an endothermic...
asked 10 months ago -
A ray of sunlight is passing from diamond into crown glass; the
angle of incidence is...
asked 10 months ago -
A block of mass 0.249 kg is placed on top of a light, vertical
spring of...
asked 10 months ago -
how do the kidneys compensate in the presences of acidosis
a) trigger hyperventilate
b) reserve acid...
asked 10 months ago -
Question 501 pts
The rental rate of capital to the firm increases. Which of the
following...
asked 10 months ago