years 2010 2011 2012 2013 2014 2015 2016 2017 2018 No. of tickets sold in berlin...
| years | 2010 | 2011 | 2012 | 2013 | 2014 | 2015 | 2016 | 2017 | 2018 |
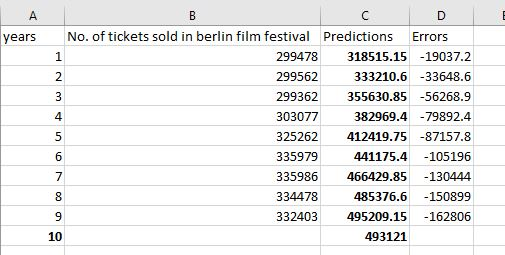
| No. of tickets sold in berlin film festival | 299478 | 299562 | 299362 | 303077 | 325262 | 335979 | 335986 | 334478 | 332403 |
Fit a appropriate trend line to the above data and estimate the sales of the tickets for the year 2019. Also estimate the prediction errors and obtain the minimum value of the error sum of squares. Comment on Result, conclusion separately and provide an appendix. Discuss which type of trend line you are using for the data and why you think it is appropriate. Generate the trend line using microsoft word. URGENT
Homework Answers
We can do this in excel as follows , we plot the scatterplot and quickly add a trend line by going to the layout of the graph and then changing the polynomial equaiton to 3
the result is

then we use the same regression equation to predict the forecast for 2019 , which is year 10


Add Answer to:
years
2010
2011
2012
2013
2014
2015
2016
2017
2018
No. of tickets sold in berlin...
Sales Cost of goods sold Accounts receivable 2015 2014 2013 $ 603,805 $ 392,081 $ 324,034...
 Sales Cost of goods sold Accounts receivable 2015 2014 2013 $ 603,805 $ 392,081 $ 324,034 292,276 189,899 158,786 29.224 22,858 22,132 2012 $ 238,260 116.265 13,962 2011 $ 180,500 86,640 12,346 Compute trend percents for the above accounts, using 2011 as the base you Trend Percent for Net Sales: Choose Denominator: Choose Numerator: 2015: 2014: 2013: 2012: Trend Percent for Cost of Goods Sold: Choose Denominator: Choose Numerator: Cost of goods sold 2015: 2014: 2013: Trend Percent for Accounts...
Pro Forma Income Statement for Ideko, 2010-2015 2013 2014 2015 2012 Year 2010 2011 Income Statement...
 Pro Forma Income Statement for Ideko, 2010-2015 2013 2014 2015 2012 Year 2010 2011 Income Statement ($ 000) 103,234 119,777 138,149 158,526 75,000 88,358 1 Sales 2 Cost of Goods Sold (16,000) (18,665) (21,593) (24,808) (28,333) (32,193) (18,000) (21,622) (25,757) (30,471) (35,834) (41,925) 64,498 3 Raw Materials 4 Direct Labor Costs 84,407 73,982 5 Gross Profit 41,000 48,071 55,883 6 Sales and Marketing (11,250) (14,579) (18,582) (23,356) (27,630) (31,705) (13,500) (13,254) (15,485) (16,769) (17,959) (20,608) 21,816 7 Administrative 8 EBITDA...
Aggravated Assault Female 2014: 85,539 2013: 82,613 2012: 88,723 2011: 90,118 2010: 92,029 2009: 92, 432...
Aggravated Assault Female 2014: 85,539 2013: 82,613 2012: 88,723 2011: 90,118 2010: 92,029 2009: 92, 432 According to data above, produce the descriptive statistics in excel ( mean, deviation, covariance, correlation coefficients)
Sales Cost of goods sold Accounts receivable 2017 2016 2015 2014 2013 $ 667,994 $ 442,380...
 Sales Cost of goods sold Accounts receivable 2017 2016 2015 2014 2013 $ 667,994 $ 442,380 $ 368,650 $ 249,688 179, 280 343, 277 227,264 191,462 128,285 91,392 32,465 2 5,968 * 25, 326 14,522 12,257 points Compute trend percents for the above accounts, using 2013 as the base year. Trend Percent for Net Sales: Choose Denominator: Choose Numerator: Sales Book 2017: 2016: 2015: 2014: erences 2014: Trend Percent for Cost of Goods Sold: 1. Choose Denominator: Choose Numerator: Cost...
Sales Cost of goods sold Accounts receivable 2017 2016 2015 2014 2013 $474,832 $314,458 $253,595 $180,495...
 Sales Cost of goods sold Accounts receivable 2017 2016 2015 2014 2013 $474,832 $314,458 $253,595 $180,495 $133,700 230,319 152,490 125,076 88,388 64,176 23,029 18,301' 17,346 10,577 9,132 Compute trend percents for the above accounts, using 2013 as the base year. Trend Percent for Net Sales: Choose Denominator: Choose Numerator: Sales 2017: 2016: 2015: 2014: Trend Percent for Cost of Goods Sold: / Choose Denominator: Choose Numerator Cost of goods sold 2017: 2016: 2015: 2014 Trend Percent for Accounts Receivables: 1...
2017 2016 2015 2014 2013 Sales Cost of goods sold Accounts receivable $ 487,090 320,454 262,667...
 2017 2016 2015 2014 2013 Sales Cost of goods sold Accounts receivable $ 487,090 320,454 262,667 176,880 132,000 63,360 9,055 236, 353 155,518 129,180 18,779 86, 252 10,312 23,673 17,940 Compute trend percents for the above accounts, using 2013 as the base year rend Percent for Net Sales: Choose Numerator: Choose Denominator Sales 2017: 2016: 2015: 2014: Trend Percent for Cost of Goods Sold: Choose Numerator: Choose Denominator Cost of goods sold 2017: 2016: 2015: 2014: Trend Percent for Accounts...
6 2017 2013 2015 $711,344 $461,912 $365,148 $248,400 $180,0ee 2016 2014 Sales Cost of goods sold...
 6 2017 2013 2015 $711,344 $461,912 $365,148 $248,400 $180,0ee 2016 2014 Sales Cost of goods sold 358,272 232,606 185,974 125,250 90,0 Accounts receivable 34,358 26,929 24,976 14,507 12, 312 10 Compute trend percents for the above accounts, using 2013 as the base year t Sales: , Choose Denominator: Sales 2017 Hint 2016 2015 2014 Choose Choose Denominator Cost of goods sold 2017 2016 2015 2014 2017 2016 2015 2014
Year 2016 2015 2014 CPI 238 577 237.017 236.736 2013 23 957 2012 2011 229.594 224.939...
 Year 2016 2015 2014 CPI 238 577 237.017 236.736 2013 23 957 2012 2011 229.594 224.939 218.056 2008 214.537 215.303 207.342 201.6 195.3 188.9 183.96 179.88 Please use the chart above for questions 4-10 4) Calculate the inflation rate from 2014 to 2015? A)-0.36% B) 9.76% C) 0.12% D) 19.3% 5) Calculate the inflation rate from 2002 to 2009 A)-0.36% B) 9.76% C) 0.12% D) 19.3% 6) Calculate the inflation rate from 2004 to 20072 A)-0.36% B) 9.76% C) 0.12%...
そ -S 2017-184 CHEN2OC 2016-17-I chen200ミ @ 2014-15-I 2013 X 2012-13.1 2011-12.1 2010-11.1 2009-101 2008-9.p +...
 そ -S 2017-184 CHEN2OC 2016-17-I chen200ミ @ 2014-15-I 2013 X 2012-13.1 2011-12.1 2010-11.1 2009-101 2008-9.p + file://C/Users/niamh/Desktop/CHEN20030/2013-14.pdf [33 %] (b) A certain natural gas of composition: 90 mole % CH4 5 mole % C2H6 5mole % N2 is burned with 20% more air (80% N2 plus 20% O2) than that required for stoichiometric reaction (ie. 120% stoichiometric). The following experimental data is available 393 242 02 (g) 30.26 90 i. Assuming that the fuel and air are fed to the...
Please answer today! I will upvote/rate. Best fitting line. Matrix. 5. Predicting Populatioin The data below records the population of Irvine, CA (in thousands of people) for the years 2010-...
 Please answer today! I will upvote/rate.
Best fitting line. Matrix.
5. Predicting Populatioin The data below records the population of Irvine, CA (in thousands of people) for the years 2010-2016: Year Population 220 2010 229 2011 2012 236 2013 247 2014 256 2015 266 2016 277 Suppose we want to use this data to predict the population in future years. (a) To use the year as a predictor variable, encode 2010 as 1, 2011 as 2, 2012 as 3, etc....
Please answer today! I will upvote/rate.
Best fitting line. Matrix.
5. Predicting Populatioin The data below records the population of Irvine, CA (in thousands of people) for the years 2010-2016: Year Population 220 2010 229 2011 2012 236 2013 247 2014 256 2015 266 2016 277 Suppose we want to use this data to predict the population in future years. (a) To use the year as a predictor variable, encode 2010 as 1, 2011 as 2, 2012 as 3, etc....
 Sales Cost of goods sold Accounts receivable 2015 2014 2013 $ 603,805 $ 392,081 $ 324,034 292,276 189,899 158,786 29.224 22,858 22,132 2012 $ 238,260 116.265 13,962 2011 $ 180,500 86,640 12,346 Compute trend percents for the above accounts, using 2011 as the base you Trend Percent for Net Sales: Choose Denominator: Choose Numerator: 2015: 2014: 2013: 2012: Trend Percent for Cost of Goods Sold: Choose Denominator: Choose Numerator: Cost of goods sold 2015: 2014: 2013: Trend Percent for Accounts...
 Pro Forma Income Statement for Ideko, 2010-2015 2013 2014 2015 2012 Year 2010 2011 Income Statement ($ 000) 103,234 119,777 138,149 158,526 75,000 88,358 1 Sales 2 Cost of Goods Sold (16,000) (18,665) (21,593) (24,808) (28,333) (32,193) (18,000) (21,622) (25,757) (30,471) (35,834) (41,925) 64,498 3 Raw Materials 4 Direct Labor Costs 84,407 73,982 5 Gross Profit 41,000 48,071 55,883 6 Sales and Marketing (11,250) (14,579) (18,582) (23,356) (27,630) (31,705) (13,500) (13,254) (15,485) (16,769) (17,959) (20,608) 21,816 7 Administrative 8 EBITDA...
 Sales Cost of goods sold Accounts receivable 2017 2016 2015 2014 2013 $ 667,994 $ 442,380 $ 368,650 $ 249,688 179, 280 343, 277 227,264 191,462 128,285 91,392 32,465 2 5,968 * 25, 326 14,522 12,257 points Compute trend percents for the above accounts, using 2013 as the base year. Trend Percent for Net Sales: Choose Denominator: Choose Numerator: Sales Book 2017: 2016: 2015: 2014: erences 2014: Trend Percent for Cost of Goods Sold: 1. Choose Denominator: Choose Numerator: Cost...
 Sales Cost of goods sold Accounts receivable 2017 2016 2015 2014 2013 $474,832 $314,458 $253,595 $180,495 $133,700 230,319 152,490 125,076 88,388 64,176 23,029 18,301' 17,346 10,577 9,132 Compute trend percents for the above accounts, using 2013 as the base year. Trend Percent for Net Sales: Choose Denominator: Choose Numerator: Sales 2017: 2016: 2015: 2014: Trend Percent for Cost of Goods Sold: / Choose Denominator: Choose Numerator Cost of goods sold 2017: 2016: 2015: 2014 Trend Percent for Accounts Receivables: 1...
 2017 2016 2015 2014 2013 Sales Cost of goods sold Accounts receivable $ 487,090 320,454 262,667 176,880 132,000 63,360 9,055 236, 353 155,518 129,180 18,779 86, 252 10,312 23,673 17,940 Compute trend percents for the above accounts, using 2013 as the base year rend Percent for Net Sales: Choose Numerator: Choose Denominator Sales 2017: 2016: 2015: 2014: Trend Percent for Cost of Goods Sold: Choose Numerator: Choose Denominator Cost of goods sold 2017: 2016: 2015: 2014: Trend Percent for Accounts...
 6 2017 2013 2015 $711,344 $461,912 $365,148 $248,400 $180,0ee 2016 2014 Sales Cost of goods sold 358,272 232,606 185,974 125,250 90,0 Accounts receivable 34,358 26,929 24,976 14,507 12, 312 10 Compute trend percents for the above accounts, using 2013 as the base year t Sales: , Choose Denominator: Sales 2017 Hint 2016 2015 2014 Choose Choose Denominator Cost of goods sold 2017 2016 2015 2014 2017 2016 2015 2014
 Year 2016 2015 2014 CPI 238 577 237.017 236.736 2013 23 957 2012 2011 229.594 224.939 218.056 2008 214.537 215.303 207.342 201.6 195.3 188.9 183.96 179.88 Please use the chart above for questions 4-10 4) Calculate the inflation rate from 2014 to 2015? A)-0.36% B) 9.76% C) 0.12% D) 19.3% 5) Calculate the inflation rate from 2002 to 2009 A)-0.36% B) 9.76% C) 0.12% D) 19.3% 6) Calculate the inflation rate from 2004 to 20072 A)-0.36% B) 9.76% C) 0.12%...
 そ -S 2017-184 CHEN2OC 2016-17-I chen200ミ @ 2014-15-I 2013 X 2012-13.1 2011-12.1 2010-11.1 2009-101 2008-9.p + file://C/Users/niamh/Desktop/CHEN20030/2013-14.pdf [33 %] (b) A certain natural gas of composition: 90 mole % CH4 5 mole % C2H6 5mole % N2 is burned with 20% more air (80% N2 plus 20% O2) than that required for stoichiometric reaction (ie. 120% stoichiometric). The following experimental data is available 393 242 02 (g) 30.26 90 i. Assuming that the fuel and air are fed to the...
 Please answer today! I will upvote/rate.
Best fitting line. Matrix.
5. Predicting Populatioin The data below records the population of Irvine, CA (in thousands of people) for the years 2010-2016: Year Population 220 2010 229 2011 2012 236 2013 247 2014 256 2015 266 2016 277 Suppose we want to use this data to predict the population in future years. (a) To use the year as a predictor variable, encode 2010 as 1, 2011 as 2, 2012 as 3, etc....
Please answer today! I will upvote/rate.
Best fitting line. Matrix.
5. Predicting Populatioin The data below records the population of Irvine, CA (in thousands of people) for the years 2010-2016: Year Population 220 2010 229 2011 2012 236 2013 247 2014 256 2015 266 2016 277 Suppose we want to use this data to predict the population in future years. (a) To use the year as a predictor variable, encode 2010 as 1, 2011 as 2, 2012 as 3, etc....
Most questions answered within 3 hours.
-
Where is the error in this code sequence?
String s1 = "Hello";
String s2 = "ello";...
asked 10 months ago -
Financial data for Joel de Paris, Inc., for last year
follow:
Joel de Paris, Inc.
Balance...
asked 10 months ago -
Consider this reaction:
Al2(SO4)3 (aq)+ BaCl3
(aq) Al2Cl6 (aq)- +
3BaSO4(s) . What is the...
asked 10 months ago -
Suppose that Savneet is considering increasing her
recent random sample from 20 car rentals to 40...
asked 10 months ago -
Trucks arrive at an unloading terminal at an average rate of 120
per hour.
Trucks arrive...
asked 10 months ago -
Why are methanol and ethanol completely soluble in water while
octanol is not very little soluble....
asked 10 months ago -
A facilities manager at a university reads in a research report
that the mean amount of...
asked 10 months ago -
When the CuSO4 is rehydrated by adding water to the anhydrous
compound, is this an endothermic...
asked 10 months ago -
A ray of sunlight is passing from diamond into crown glass; the
angle of incidence is...
asked 10 months ago -
A block of mass 0.249 kg is placed on top of a light, vertical
spring of...
asked 10 months ago -
how do the kidneys compensate in the presences of acidosis
a) trigger hyperventilate
b) reserve acid...
asked 10 months ago -
Question 501 pts
The rental rate of capital to the firm increases. Which of the
following...
asked 10 months ago