


Homework Answers
Add Answer to:
Problems 10-15 are based on the demand and supply schedules for gasoline below (all quantities are...
Problems 16-19 are based on the following demand and supply schedules for corn (all quantities are...
 Problems 16-19 are based on the following demand and supply schedules for corn (all quantities are in mil- lions of bushels per year). Price per bushel Quantity demanded Quantity supplied $0 2 16. Draw the demand and supply curves for corn. What is the equilibrium price? The equilibrium quantity? 17. Suppose the government now imposes a price floor at $4 per bushel. Show the effect of this program graphically. How large is the surplus of corn? 18. With the price...
The local orange juice market in Arden-Arcade has demand and supply curves given by the following...
The local orange juice market in Arden-Arcade has demand and supply curves given by the following data. (All quantities are in thousands of gallons per week.) Price per gallon $1.75 $2.00 $2.25 $2.50 $2.75 $3.00 $3.25 Quantity demanded 10 9 8 7 6 5 4 Quantity supplied 0 4 8 12 16 20 24 What are the equilibrium price and quantity of orange juice? Group of answer choices $3.25 and 4 $2.25 and 8 $2.50 and 12 $1.75 and 10
1. The following are the assumed supply and demand schedules for Pepsi in Farmingdale in February...
 1. The following are the assumed supply and demand schedules for Pepsi in Farmingdale in February 2015: Demand Schedule Supply Schedule Quantity Quantity Demanded per year Supplied per year Price $2.25 $2.00 $1.75 $1.50 $1.25 $1.00 (thousands) (thousands) 16 20 24 28 32 Price $2.25 $2.00 $1.75 $1.50 $1.25 $1.00 30 28 26 24 20 A. Plot the supply and demand curves and indicate the equilibrium price and quantity Define: a) equilibrium price b) equilibrium quantity What effect would an...
1. The demand and supply schedules for pop in Vancouver are as follows: Price ($/pack of...
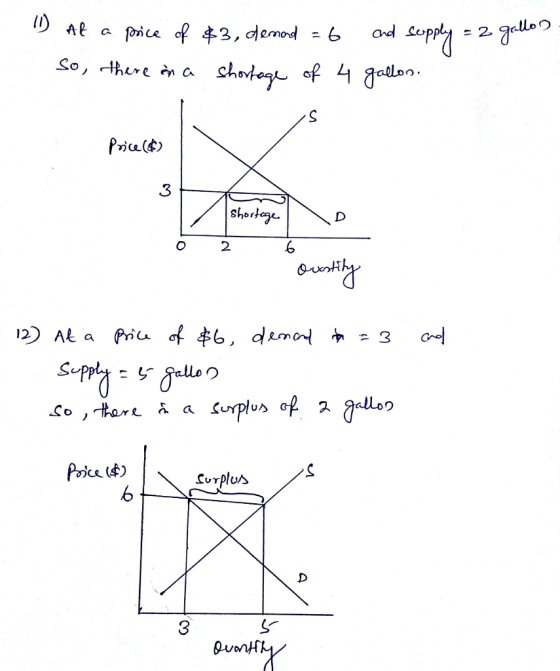
1. The demand and supply schedules for pop in Vancouver are as follows: Price ($/pack of 2 bottles) Quantity demanded (thousands /week) Quantity supplied (thousands/ week) 2 280 0 3 240 30 4 200 60 5 160 90 6 120 120 7 80 140 8 40 160 9 0 180 Quantity demanded (thousands /week) 1) With the use of a demand and supply diagram, show the market equilibrium. b. Now suppose that a fire destroys one half of the pop...
Spply and Demand The table below shows the market for olives (the quantities are in thousands...
 Spply and Demand The table below shows the market for olives (the quantities are in thousands of kilos per year). Plot the demand and supply curves on the graph below and label them D and S for demand and supply. Be sure to include prices and quantities on the axes. What are the values for the equilibrium price and quantity? Prices Quantity Demanded Quantity Supplied 8 10 12 14 700 600 500 400 300 200 100 100 200 300 100...
Dollars per Gallon 10 20 30 40 50 Millions of Gallons per Day For a gasoline...
 Dollars per Gallon 10 20 30 40 50 Millions of Gallons per Day For a gasoline market, at a price of $3.00 per gallon of gasoline, there would be more quantity demanded than quantity supplied a shortage of gasoline. an equilibrium. a surplus of gasoline. For a gasoline market, at a price of $1.5 per gallon of gasoline, there would be O a surplus of gasoline. O a shortage of gasoline. O an equilibrium. more quantity supplied than quantity demanded
Q.2 (15 points) The following table shows the demand for gasoline by a public bus and...
 Q.2 (15 points) The following table shows the demand for gasoline by a public bus and the demand for gasoline by a private car. Price (per gallon) Demand for gasoline (per week) Quantity demanded by a Quantity demanded by a private public bus (gallons) car (gallons) S3.2 75 25 $3.0 80 40 $2.8 85 55 $2.6 90 70 95 85 $2.2 100 100 (a) Suppose the price of gasoline increases from $2.4 to $2.6. Calculate the price elasticity of demand...
The supply and demand schedules for the umbrella market are given below. At a price of...
 The supply and demand schedules for the umbrella market are given below. At a price of umbrellas. there would be an excess of of Price Quantity Supplied 400 510 Quantity Demanded 700 650 S15 500 520 600 600 700 S25 550 S30 800 500 A530; demand 8.510 demand 520: supply D.520: demand E510: supply
This table shows the US domestic demand and supply schedules for oranges. Suppose the world price...
This table shows the US domestic demand and supply schedules for oranges. Suppose the world price of oranges is $0.30 per orange. Quantities are in thousands. Price Quantity of oranges Demanded Quantity of oranges Supplied $1.00 2 11 0.90 4 10 0.80 6 9 0.70 8 8 0.60 10 7 0.50 12 6 0.40 14 5 0.30 16 4 0.20 18 3 Draw the US domestic supply and demand schedules With free trade, how will the US import or export? How many?...
Scenario 10-1 The demand curve for gasoline slopes downward and the supply curve for gasoline slopes...
 Scenario 10-1 The demand curve for gasoline slopes downward and the supply curve for gasoline slopes upward. The production of the 200th gallon of gasoline entails the following: . a private cost of $3.03; • a social cost of $3.23; • a value to consumers of $3.39. Refer to Scenario 10-1. Suppose the equilibrium quantity of gasoline is 220 gallons; that is, Q MARKET = 220. Then the equilibrium price of a gallon could be a. $3.08. b.$2.77. C. $2.45....
 Problems 16-19 are based on the following demand and supply schedules for corn (all quantities are in mil- lions of bushels per year). Price per bushel Quantity demanded Quantity supplied $0 2 16. Draw the demand and supply curves for corn. What is the equilibrium price? The equilibrium quantity? 17. Suppose the government now imposes a price floor at $4 per bushel. Show the effect of this program graphically. How large is the surplus of corn? 18. With the price...
 1. The following are the assumed supply and demand schedules for Pepsi in Farmingdale in February 2015: Demand Schedule Supply Schedule Quantity Quantity Demanded per year Supplied per year Price $2.25 $2.00 $1.75 $1.50 $1.25 $1.00 (thousands) (thousands) 16 20 24 28 32 Price $2.25 $2.00 $1.75 $1.50 $1.25 $1.00 30 28 26 24 20 A. Plot the supply and demand curves and indicate the equilibrium price and quantity Define: a) equilibrium price b) equilibrium quantity What effect would an...
 Spply and Demand The table below shows the market for olives (the quantities are in thousands of kilos per year). Plot the demand and supply curves on the graph below and label them D and S for demand and supply. Be sure to include prices and quantities on the axes. What are the values for the equilibrium price and quantity? Prices Quantity Demanded Quantity Supplied 8 10 12 14 700 600 500 400 300 200 100 100 200 300 100...
 Dollars per Gallon 10 20 30 40 50 Millions of Gallons per Day For a gasoline market, at a price of $3.00 per gallon of gasoline, there would be more quantity demanded than quantity supplied a shortage of gasoline. an equilibrium. a surplus of gasoline. For a gasoline market, at a price of $1.5 per gallon of gasoline, there would be O a surplus of gasoline. O a shortage of gasoline. O an equilibrium. more quantity supplied than quantity demanded
 Q.2 (15 points) The following table shows the demand for gasoline by a public bus and the demand for gasoline by a private car. Price (per gallon) Demand for gasoline (per week) Quantity demanded by a Quantity demanded by a private public bus (gallons) car (gallons) S3.2 75 25 $3.0 80 40 $2.8 85 55 $2.6 90 70 95 85 $2.2 100 100 (a) Suppose the price of gasoline increases from $2.4 to $2.6. Calculate the price elasticity of demand...
 The supply and demand schedules for the umbrella market are given below. At a price of umbrellas. there would be an excess of of Price Quantity Supplied 400 510 Quantity Demanded 700 650 S15 500 520 600 600 700 S25 550 S30 800 500 A530; demand 8.510 demand 520: supply D.520: demand E510: supply
 Scenario 10-1 The demand curve for gasoline slopes downward and the supply curve for gasoline slopes upward. The production of the 200th gallon of gasoline entails the following: . a private cost of $3.03; • a social cost of $3.23; • a value to consumers of $3.39. Refer to Scenario 10-1. Suppose the equilibrium quantity of gasoline is 220 gallons; that is, Q MARKET = 220. Then the equilibrium price of a gallon could be a. $3.08. b.$2.77. C. $2.45....
Most questions answered within 3 hours.
-
Where is the error in this code sequence?
String s1 = "Hello";
String s2 = "ello";...
asked 10 months ago -
Financial data for Joel de Paris, Inc., for last year
follow:
Joel de Paris, Inc.
Balance...
asked 10 months ago -
Consider this reaction:
Al2(SO4)3 (aq)+ BaCl3
(aq) Al2Cl6 (aq)- +
3BaSO4(s) . What is the...
asked 10 months ago -
Suppose that Savneet is considering increasing her
recent random sample from 20 car rentals to 40...
asked 10 months ago -
Trucks arrive at an unloading terminal at an average rate of 120
per hour.
Trucks arrive...
asked 10 months ago -
Why are methanol and ethanol completely soluble in water while
octanol is not very little soluble....
asked 10 months ago -
A facilities manager at a university reads in a research report
that the mean amount of...
asked 10 months ago -
When the CuSO4 is rehydrated by adding water to the anhydrous
compound, is this an endothermic...
asked 10 months ago -
A ray of sunlight is passing from diamond into crown glass; the
angle of incidence is...
asked 10 months ago -
A block of mass 0.249 kg is placed on top of a light, vertical
spring of...
asked 10 months ago -
how do the kidneys compensate in the presences of acidosis
a) trigger hyperventilate
b) reserve acid...
asked 10 months ago -
Question 501 pts
The rental rate of capital to the firm increases. Which of the
following...
asked 10 months ago