Given the following demand and supply functions: P= $500-$10Qd and P=$100 + $20Qs (a) Set up...
Given the following demand and supply functions: P= $500-$10Qd and P=$100 + $20Qs
(a) Set up a table in excel to calculate the values of quantity demanded and supplied over the range of relevant prices (remember, think about the lowest and highest possible price in this market for your range; then determine what increments you would like to use. You shouldn’t use increments of 1 unit. Think about what would be more reasonable given your equations).
(b). Highlight the row corresponding to the equilibrium in the market. (if there is no exact row showing equilibrium, then highlight the two rows for which the equilibrium falls between).
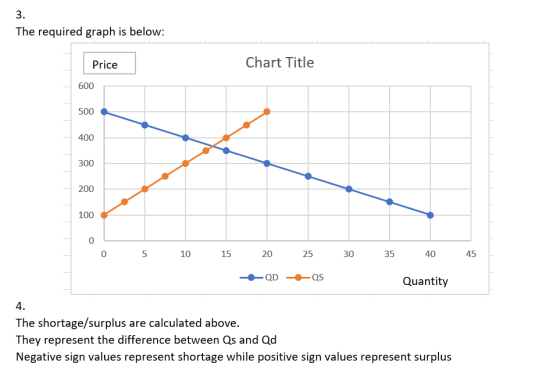
(c). Graph the demand and supply curves together for the overall market. Be sure to label your axes, curves, and title your chart. Print your graph again conforming to normal standards of the page layout.
(d). Determine the amount of shortage or surplus at each price point (add a column to your table for surplus/shortage). When you are done with this question, you will need to print out your spreadsheet showing all rows and columns. Adjust your page layout to make them print in a reasonable font—you may use either portrait or landscape.
Homework Answers

Add Answer to:
Given the following demand and supply functions: P=
$500-$10Qd and P=$100 + $20Qs
(a) Set up...
A market demand and supply functions are as follows: Qd = 500 - P/4, and Qs...
A market demand and supply functions are as follows: Qd = 500 - P/4, and Qs = P/2 - 100. For parts 2-5, use ONE graph. 1. Determine the equilibrium price and quantity. 2. Graph the inverse demand and supply curves with Q on the horizontal axis and P on the vertical axis. Clearly label all axes, curves, intercepts, and the equilibrium price and quantity values 3.Assume the government sets a rule that the selling price cannot go above $400....
Assume we have demand and supply, P= $4600 - 80Qd and P= $1400 + $20Qs. Determine...
Assume we have demand and supply, P= $4600 - 80Qd and P= $1400 + $20Qs. Determine the equilibrium price and quantity. Graph the market showing the reservation price and minimum selling price, Pe and Qe and calculate the areas of consumer surplus and producer surplus, and label the areas on the graph
Your demand and supply functions are given by D: P=50-Q and S: P=10+3Q. Determine the market...
Your demand and supply functions are given by D: P=50-Q and S: P=10+3Q. Determine the market equilibrium price and quantity. If a price floor is put into place at P=30, determines the shortage or surplus, if any (think carefully). Draw a graph and show your calculations for full credit.
και ειεται υ.ιιωμι Question 1 (8 points) Assume we have demand and supply, P=$4600-$80Qd and P=$1400...
 και ειεται υ.ιιωμι Question 1 (8 points) Assume we have demand and supply, P=$4600-$80Qd and P=$1400 + $20Qs. Determine the equilibrium price and quantity (write in those answers here). Then on paper, graph the market showing the reservation price and minimum selling price, Pe, and Qe, and calculate the areas of consumer surplus and producer surplus, and label the areas on your graph. Be sure to show all of your work on paper for uploading
Consider a market with demand and supply functions: Supply function: ? = 40? − 40 Demand...
Consider a market with demand and supply functions: Supply function: ? = 40? − 40 Demand function: ? = 200 − 20? a. Draw the demand-supply curves. Find equilibrium price and quantity. Find consumer surplus, producer surplus, and total surplus in the graph. b. Calculate exact size of consumer surplus, producer surplus, and total surplus, respectively. Welfare effects of a price control. The government sets a price floor at $5. c. Find the market price and quantity traded, and the...
Q. Given the following supply and demand functions, calculate consumer surplus. P = 600 − Qd...
Q. Given the following supply and demand functions, calculate consumer surplus. P = 600 − Qd P = 300 + 2QS Q. Consider the market for jet fuel in a remote regional airport. The domestic demand and supply curves are given as (Qs are gallons in thousands): P = 55 − 3QD P = 5 + 7 QS a) What is the market equilibrium price and quantity? b) If the government imposes a price ceiling of $28, what will be...
The following graph shows the monthly demand and supply curves in the market for calendars.
 12. Market equilibrium and disequilibrium The following graph shows the monthly demand and supply curves in the market for calendars. Use the graph input tool to help you answer the following questions. Enter an amount into the Price field to see the quantity demanded and quantity supplied at that price. You will not be graded on any changes you make to this graph. The equilibrium price in this market is _______ per calendar, and the equilibrium quantity is _______ calendars bought and sold...
The following graph shows the monthly demand and supply curves in the market for hats.
 12. Market equilibrium and disequilibrium The following graph shows the monthly demand and supply curves in the market for hats. Use the graph input tool to help you answer the following questions. Enter an amount into the Price field to see the quantity demanded and quantity supplied at that price. You will not be graded on any changes you make to this graph. The equilibrium price in this market is _______ per hat, and the equilibrium quantity is _______ hats bought and sold...
6. Given the following demand and supply curve, Qd = 500 - 4P and Qs =...
6. Given the following demand and supply curve, Qd = 500 - 4P and Qs = 5P - 400 a. Calculate and graph the market equilibrium, P and Q b. If the government raises the price to $105, calculate and graph the surplus or shortage that it creates
The demand and supply curves for the market of grains in Idaho is given below. Use...
 The demand and supply curves for the market of grains in Idaho is given below. Use the graph to answer the question that follows. 10 demand Supply 9 Policy price 2 4 68 1012 14 Quantity of Grains in (tons) a. (0.5 pt) If the current market price of grain its at $7, thinking of market equilibrium, what would you expect in this market (shortage or surplus)?. b. (0.5pt) How will the problem identified above be solved in order for...
 και ειεται υ.ιιωμι Question 1 (8 points) Assume we have demand and supply, P=$4600-$80Qd and P=$1400 + $20Qs. Determine the equilibrium price and quantity (write in those answers here). Then on paper, graph the market showing the reservation price and minimum selling price, Pe, and Qe, and calculate the areas of consumer surplus and producer surplus, and label the areas on your graph. Be sure to show all of your work on paper for uploading
 The demand and supply curves for the market of grains in Idaho is given below. Use the graph to answer the question that follows. 10 demand Supply 9 Policy price 2 4 68 1012 14 Quantity of Grains in (tons) a. (0.5 pt) If the current market price of grain its at $7, thinking of market equilibrium, what would you expect in this market (shortage or surplus)?. b. (0.5pt) How will the problem identified above be solved in order for...
Most questions answered within 3 hours.
-
Where is the error in this code sequence?
String s1 = "Hello";
String s2 = "ello";...
asked 10 months ago -
Financial data for Joel de Paris, Inc., for last year
follow:
Joel de Paris, Inc.
Balance...
asked 10 months ago -
Consider this reaction:
Al2(SO4)3 (aq)+ BaCl3
(aq) Al2Cl6 (aq)- +
3BaSO4(s) . What is the...
asked 10 months ago -
Suppose that Savneet is considering increasing her
recent random sample from 20 car rentals to 40...
asked 10 months ago -
Trucks arrive at an unloading terminal at an average rate of 120
per hour.
Trucks arrive...
asked 10 months ago -
Why are methanol and ethanol completely soluble in water while
octanol is not very little soluble....
asked 10 months ago -
A facilities manager at a university reads in a research report
that the mean amount of...
asked 10 months ago -
When the CuSO4 is rehydrated by adding water to the anhydrous
compound, is this an endothermic...
asked 10 months ago -
A ray of sunlight is passing from diamond into crown glass; the
angle of incidence is...
asked 10 months ago -
A block of mass 0.249 kg is placed on top of a light, vertical
spring of...
asked 10 months ago -
how do the kidneys compensate in the presences of acidosis
a) trigger hyperventilate
b) reserve acid...
asked 10 months ago -
Question 501 pts
The rental rate of capital to the firm increases. Which of the
following...
asked 10 months ago