
Homework Answers

Add Answer to:
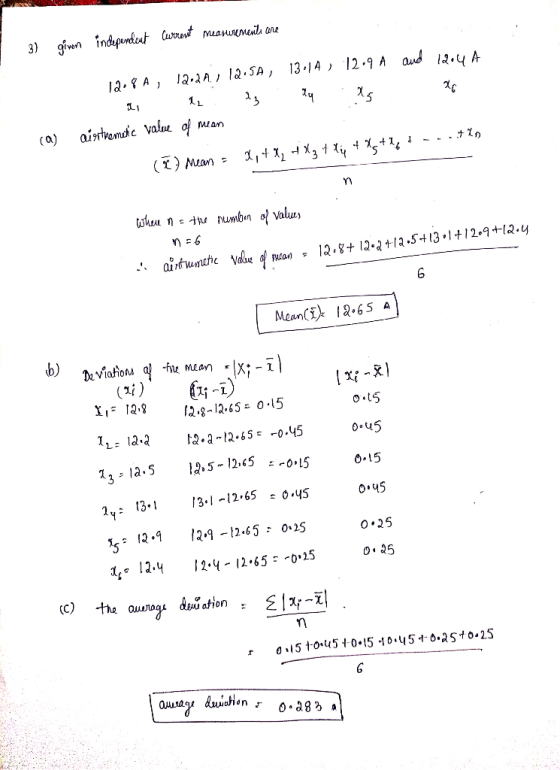
3. A set of independent current measurements were taken by six observers were recorded as 12.8A,...
The following measurements (in picocuries per liter) were recorded by a set of radon gas detectors...
 The following measurements (in picocuries per liter) were recorded by a set of radon gas detectors installed in a laboratory facility: 382, 361.2, 333, 348.3, 385.1, 332.2, 380.7 Using these measurements, construct a 95 % confidence interval for the mean level of radon gas present in the facility. Assume the population is approximately normal. Copy Data Step 3 of 4: Find the critical value that should be used in constructing the confidence interval. Round your answer to three decimal places...
The following measurements (in picocuries per liter) were recorded by a set of carbon monoxide detectors...
The following measurements (in picocuries per liter) were recorded by a set of carbon monoxide detectors installed in a waste disposal facility: 487.4,473.8,534.3 Using these measurements, construct a 95% confidence interval for the mean level of carbon monoxide present in the facility. Assume the population is approximately normal. step 1: sample mean round two decimal places step 2 sample standard deviation two decimal places step 3 find critical vaue of confidence level round three decimal places step 4 contruct the...
The following measurements (in picocuries per liter) were recorded by a set of xenon gas detectors...
The following measurements (in picocuries per liter) were recorded by a set of xenon gas detectors installed in a waste disposal facility: 622.2, 619.6, 632.4, 652.8, 634.4, 637.3 Using these measurements, construct a 95% confidence interval for the mean level of xenon gas present in the facility. Assume the population is approximately normal. Step 1 of 4: Calculate the sample mean for the given sample data. Round your answer to two decimal places. Step 2 of 4: Calculate the sample...
The following measurements (in picocuries per liter) were recorded by a set of argon gas detectors...
The following measurements (in picocuries per liter) were recorded by a set of argon gas detectors installed in a research facility: 831.7, 847.2, 820.9, 826.3 Using these measurements, construct a 95% confidence interval for the mean level of argon gas present in the facility. Assume the population is approximately normal. Step 1. Calculate the sample mean for the given sample data. Round your answer to two decimal places. Answer: ____________________ Step 2. Calculate the sample standard deviation for the given...
The following measurements (in picocuries per liter) were recorded by a set of carbon dioxide detectors...
The following measurements (in picocuries per liter) were recorded by a set of carbon dioxide detectors installed in a research facility: 227.6, 219.6, 221.1 Using these measurements, construct a 99% confidence interval for the mean level of carbon dioxide present in the facility. Assume the population is approximately normal. Copy Data Step 3 of 4 : Find the critical value that should be used in constructing the confidence interval. Round your answer to three decimal places.
In the Free Fall Lab, you will take 6 independent measurements for the free fall time...
In the Free Fall Lab, you will take 6 independent measurements for the free fall time of an object from the same height. A)Why is time an independent variable? B)Assume the average value of the six measurements was 1.8 s with standard deviation of 0.1 s. How do you find the error in the free fall time average?
Please be as detailed as possible and provide solution without using to software Problem 3 sample of 15 measurements was taken and the sample mean was 3.7867 and the sample variance was 0.94265. Assu...
 Please be as detailed as possible and provide solution without
using to software
Problem 3 sample of 15 measurements was taken and the sample mean was 3.7867 and the sample variance was 0.94265. Assuming that the measurements represent a random sample from a normal population, (24 points): Measurements were recorded for the aeriation time of a process. A random a) Construct a 95% confidence interval for the mean drying time Construct a 95% prediction interval for the drying time for...
Please be as detailed as possible and provide solution without
using to software
Problem 3 sample of 15 measurements was taken and the sample mean was 3.7867 and the sample variance was 0.94265. Assuming that the measurements represent a random sample from a normal population, (24 points): Measurements were recorded for the aeriation time of a process. A random a) Construct a 95% confidence interval for the mean drying time Construct a 95% prediction interval for the drying time for...
4.2 The following 10 measurements of the freezing point of aluminum were made using a platinum/rhodium...
 4.2 The following 10 measurements of the freezing point of aluminum were made using a platinum/rhodium thermocouple. 658.2 659.8 661.7 662.1 659.3 660.5 657.9 662.4 659.6 662.2 Find (a) the median, (b) the mean, (c) the standard deviation, and (d) the variance of the measurements. 4.7 A pressure control system in a distillation column is designed to maintain the pres- sure at a constant value of 10.9 bar. The following 10 pressure readings (in bars) were obtained at intervals of...
My Notes Ask Your Te You are given n 8 measurements: 5, 3, 6, 6, 6,...
 My Notes Ask Your Te You are given n 8 measurements: 5, 3, 6, 6, 6, 6, 4, 7, (a) Calculate the range 4 (b) Calculate the sample mean, X. x5.375 (c) Calculate the sample variance, s2, and standard deviation, s. (Round your variance to four decimal places and your standard deviation to two decimal places.) s211.87 s= 3.44 (d) Compare the range and the standard deviation. The range is approximately how many standard deviations? Round your answer to two...
3.1 Forty nine samples of a performance metric were taken during a Six Sigma project. The...
3.1 Forty nine samples of a performance metric were taken during a Six Sigma project. The average of the samples was calculated to be 25. Suppose we know the population standard deviation is 3. Find the 97% confidence interval for the population mean of the performance metric. 3.2 If the confidence level is changed from 95% to 98%, derive the formula for the confidence interval. More help on 3 part 2
 The following measurements (in picocuries per liter) were recorded by a set of radon gas detectors installed in a laboratory facility: 382, 361.2, 333, 348.3, 385.1, 332.2, 380.7 Using these measurements, construct a 95 % confidence interval for the mean level of radon gas present in the facility. Assume the population is approximately normal. Copy Data Step 3 of 4: Find the critical value that should be used in constructing the confidence interval. Round your answer to three decimal places...
 Please be as detailed as possible and provide solution without
using to software
Problem 3 sample of 15 measurements was taken and the sample mean was 3.7867 and the sample variance was 0.94265. Assuming that the measurements represent a random sample from a normal population, (24 points): Measurements were recorded for the aeriation time of a process. A random a) Construct a 95% confidence interval for the mean drying time Construct a 95% prediction interval for the drying time for...
Please be as detailed as possible and provide solution without
using to software
Problem 3 sample of 15 measurements was taken and the sample mean was 3.7867 and the sample variance was 0.94265. Assuming that the measurements represent a random sample from a normal population, (24 points): Measurements were recorded for the aeriation time of a process. A random a) Construct a 95% confidence interval for the mean drying time Construct a 95% prediction interval for the drying time for...
 4.2 The following 10 measurements of the freezing point of aluminum were made using a platinum/rhodium thermocouple. 658.2 659.8 661.7 662.1 659.3 660.5 657.9 662.4 659.6 662.2 Find (a) the median, (b) the mean, (c) the standard deviation, and (d) the variance of the measurements. 4.7 A pressure control system in a distillation column is designed to maintain the pres- sure at a constant value of 10.9 bar. The following 10 pressure readings (in bars) were obtained at intervals of...
 My Notes Ask Your Te You are given n 8 measurements: 5, 3, 6, 6, 6, 6, 4, 7, (a) Calculate the range 4 (b) Calculate the sample mean, X. x5.375 (c) Calculate the sample variance, s2, and standard deviation, s. (Round your variance to four decimal places and your standard deviation to two decimal places.) s211.87 s= 3.44 (d) Compare the range and the standard deviation. The range is approximately how many standard deviations? Round your answer to two...
Most questions answered within 3 hours.
-
Where is the error in this code sequence?
String s1 = "Hello";
String s2 = "ello";...
asked 11 months ago -
Financial data for Joel de Paris, Inc., for last year
follow:
Joel de Paris, Inc.
Balance...
asked 11 months ago -
Consider this reaction:
Al2(SO4)3 (aq)+ BaCl3
(aq) Al2Cl6 (aq)- +
3BaSO4(s) . What is the...
asked 11 months ago -
Suppose that Savneet is considering increasing her
recent random sample from 20 car rentals to 40...
asked 11 months ago -
Trucks arrive at an unloading terminal at an average rate of 120
per hour.
Trucks arrive...
asked 11 months ago -
Why are methanol and ethanol completely soluble in water while
octanol is not very little soluble....
asked 11 months ago -
A facilities manager at a university reads in a research report
that the mean amount of...
asked 11 months ago -
When the CuSO4 is rehydrated by adding water to the anhydrous
compound, is this an endothermic...
asked 11 months ago -
A ray of sunlight is passing from diamond into crown glass; the
angle of incidence is...
asked 11 months ago -
A block of mass 0.249 kg is placed on top of a light, vertical
spring of...
asked 11 months ago -
how do the kidneys compensate in the presences of acidosis
a) trigger hyperventilate
b) reserve acid...
asked 11 months ago -
Question 501 pts
The rental rate of capital to the firm increases. Which of the
following...
asked 11 months ago