

Homework Answers
Solution
Q1
The area of the shaded region
= P(Z < 1.6) – P(Z < - 0.9)
= 0.9452 – 0.1841
[referring Standard Normal Tables or Using Excel Function: Statistical NORMSDIST]
= 0.7611 Second Option Answer
Q2
If t is the Z-score corresponding to P99, then by definition, P(Z < t) = 0.99
=> t = 2.3263 [referring Standard Normal Tables or Using Excel Function: Statistical NORMSINV]
First Option Answer
Q3
Unable to provide answer because the image is cropped at the right. Answer
DONE
Add Answer to:
ind the area of the shaded region under the standard distri z =-0.90-t t z 1.60...
3. Find the area of the shaded region under the standard distribution curve. (1 point) z...
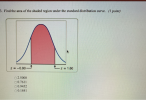 3. Find the area of the shaded region under the standard distribution curve. (1 point) z =-0.90-t t_z = 1.60 O2.5000 0 0.761 1 00.9452 0.1841
11. Find the area of the shaded region under the standard normal curve. If convenient, use...
11. Find the area of the shaded region under the standard normal curve. If convenient, use technology to find the area. z -2.13 0 A normal curve is over a horizontal z-axis and is centered at 0. Vertical line segments extend from the horizontal axis to the curve at negative 2.13 and 0. The area under the curve between negative 2.13 and 0 is shaded. The area of the shaded region is nothing. (Round to four decimal places as needed.)
0-0.57 00.57 4. Find the area of the shaded region. The graph depicts the standard normal...
 0-0.57 00.57 4. Find the area of the shaded region. The graph depicts the standard normal distribution with mean 0 and standard deviation 1. -339-226-113 1.13 226 339z о 0.8907 01292 0.8708 0.8485 ind the indicated z score. The graph depicts the standard norn
Find the area of the shaded region under the standard normal curve. If convenient, use technology...
 Find the area of the shaded region under the standard normal curve. If convenient, use technology to find the area. The area of the shaded region is (Round to four decimal places as needed.) } More Find the area of the shaded region under the standard normal curve. If convenient, use technology to find the area. 0 The area of the shaded region is (Round to four decimal places as needed.)
Find the area of the shaded region. The graph depicts the standard normal distribution of bone...
Find the area of the shaded region. The graph depicts the standard normal distribution of bone density scores with mean 0 and standard deviation 1. z= -0.84 A symmetric bell-shaped curve is plotted over a horizontal scale. A vertical line runs from the scale to the curve at labeled coordinate “z equals negative 0.84,” which is to the left of the curve’s center and peak. The area under the curve to the right of the vertical line is shaded. The...
Find the area of the shaded region. The graph depicts the standard normal distribution of bone...
Find the area of the shaded region. The graph depicts the standard normal distribution of bone density scores with mean 0 and standard deviation 1. z=−0.92 z=1.25 A symmetric bell-shaped curve is plotted over a horizontal scale. Two vertical lines run from the scale to the curve at labeled coordinates “z equals negative 0.92,” which is to the left of the curve’s center and peak, and “z equals 1.25,” which is to the right of the curve’s center and peak....
Find the area of the shaded region. The graph depicts the standard normal distribution of bone...
Find the area of the shaded region. The graph depicts the standard normal distribution of bone density scores with mean 0 and standard deviation 1. z= -0.92 A symmetric bell-shaped curve is plotted over a horizontal scale. A vertical line runs from the scale to the curve at labeled coordinate “z equals negative 0.92,” which is to the left of the curve’s center and peak. The area under the curve to the right of the vertical line is shaded. The...
Find the area of the shaded region. The graph depicts the standard normal distribution of bone...
Find the area of the shaded region. The graph depicts the standard normal distribution of bone density scores with mean 0 and standard deviation 1. font size decreased by 2 z equals negative 0.89font size decreased by 2 z equals 1.27 A symmetric bell-shaped curve is plotted over a horizontal scale. Two vertical lines run from the scale to the curve at labeled coordinates “z equals negative 0.89,” which is to the left of the curve’s center and peak, and...
Find the area of the shaded region. The graph depicts the standard normal distribution with mean...
Find the area of the shaded region. The graph depicts the standard normal distribution with mean 0 and standard deviation 1. Click to view page 1 of the table. LOADING... Click to view page 2 of the table. LOADING... z equals 0.88 A graph with a bell-shaped curve, divided into 2 regions by a line from top to bottom on the right side. The region left of the line is shaded. The z-axis below the line is labeled "z=0.88". The...
Find the area of the shaded region. The graph depicts the standard normal distribution of bone...
Find the area of the shaded region. The graph depicts the standard normal distribution of bone density scores with mean 0 and standard deviation 1. font size decreased by 2 z equals negative 0.95z=−0.95 font size decreased by 2 z equals 1.24z=1.24 A symmetric bell-shaped curve is plotted over a horizontal scale. Two vertical lines run from the scale to the curve at labeled coordinates “z equals negative 0.95,” which is to the left of the curve’s center and peak,...
 3. Find the area of the shaded region under the standard distribution curve. (1 point) z =-0.90-t t_z = 1.60 O2.5000 0 0.761 1 00.9452 0.1841
 0-0.57 00.57 4. Find the area of the shaded region. The graph depicts the standard normal distribution with mean 0 and standard deviation 1. -339-226-113 1.13 226 339z о 0.8907 01292 0.8708 0.8485 ind the indicated z score. The graph depicts the standard norn
 Find the area of the shaded region under the standard normal curve. If convenient, use technology to find the area. The area of the shaded region is (Round to four decimal places as needed.) } More Find the area of the shaded region under the standard normal curve. If convenient, use technology to find the area. 0 The area of the shaded region is (Round to four decimal places as needed.)
Most questions answered within 3 hours.
-
Where is the error in this code sequence?
String s1 = "Hello";
String s2 = "ello";...
asked 11 months ago -
Financial data for Joel de Paris, Inc., for last year
follow:
Joel de Paris, Inc.
Balance...
asked 11 months ago -
Consider this reaction:
Al2(SO4)3 (aq)+ BaCl3
(aq) Al2Cl6 (aq)- +
3BaSO4(s) . What is the...
asked 11 months ago -
Suppose that Savneet is considering increasing her
recent random sample from 20 car rentals to 40...
asked 11 months ago -
Trucks arrive at an unloading terminal at an average rate of 120
per hour.
Trucks arrive...
asked 11 months ago -
Why are methanol and ethanol completely soluble in water while
octanol is not very little soluble....
asked 11 months ago -
A facilities manager at a university reads in a research report
that the mean amount of...
asked 11 months ago -
When the CuSO4 is rehydrated by adding water to the anhydrous
compound, is this an endothermic...
asked 11 months ago -
A ray of sunlight is passing from diamond into crown glass; the
angle of incidence is...
asked 11 months ago -
A block of mass 0.249 kg is placed on top of a light, vertical
spring of...
asked 11 months ago -
how do the kidneys compensate in the presences of acidosis
a) trigger hyperventilate
b) reserve acid...
asked 11 months ago -
Question 501 pts
The rental rate of capital to the firm increases. Which of the
following...
asked 11 months ago