A phycologist is interested in determining the proportion of algae samples from a local rivulet that...
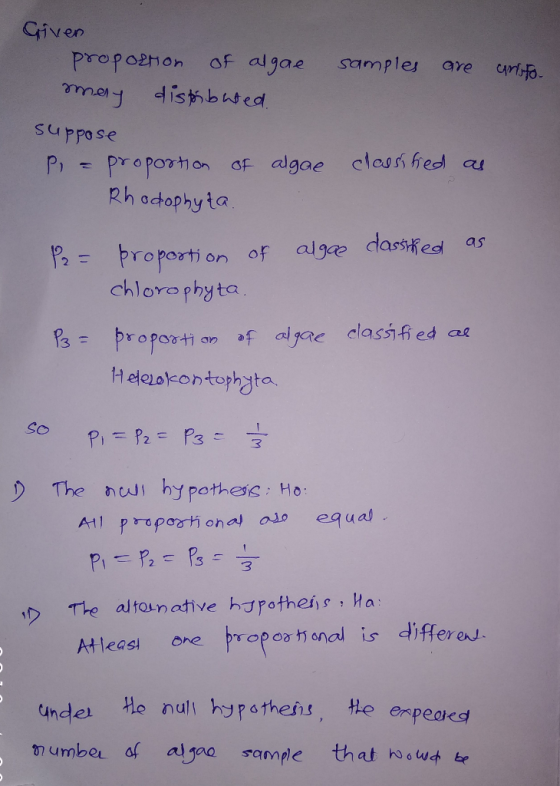
A phycologist is interested in determining the proportion of algae samples from a local rivulet that belong to a particular phyla, and he believes they should be uniformly distributed. A random sample of 60 algae were obtained, and each was categorized as being Rhodophyta, Chlorophyta, or Heterokontophyta. The observed counts were 35, 15, and 10, respectively.
1. The null hypothesis is
A. H0:p1=3560,p2=1560,p3=1060H0:p1=3560,p2=1560,p3=1060
B. H0:p1=p2=p3=13H0:p1=p2=p3=13
C. H0:H0: at least one of the proportions is different
D. H0:p1=135,p2=115,p3=110H0:p1=135,p2=115,p3=110
2. The alternative hypothesis is
A. Ha:p1=p2=p3=13Ha:p1=p2=p3=13
B. Ha:Ha:at least one of the proportions is different
C. Ha:p1?13,p2?13,p3?13Ha:p1?13,p2?13,p3?13
D. Ha:p1?1550,p2?2550,p3?1050Ha:p1?1550,p2?2550,p3?1050
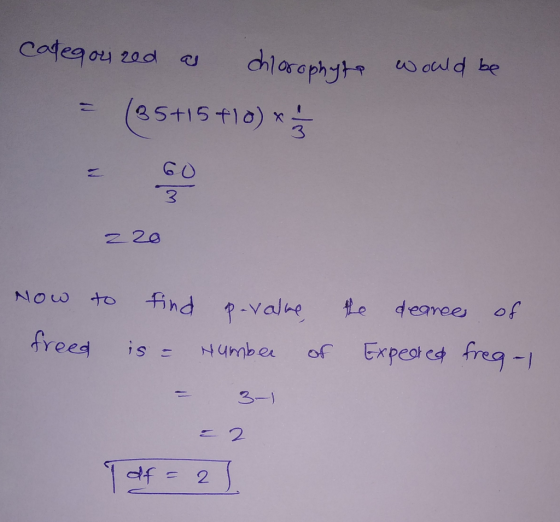
Under the null hypothesis, the expected number of algae samples
that would be categorized as Chlorophyta would be ______
When determining the p-value, the phycologist would use ______
degrees of freedom.
Homework Answers
Add Answer to:
A phycologist is interested in determining the proportion of
algae samples from a local rivulet that...
Suppose that based on two independent samples, the 95% confidence interval for the difference between two...
Suppose that based on two independent samples, the 95% confidence interval for the difference between two population proportions, p1−p2 is (-0.29, -0.01). If a test of hypotheses H0: p1−p2 = 0 versus Ha: p1−p2 ≠ 0 was conducted at 0.05 level of significance based on these samples, the decision would be to .. retain the null hypothesis? reject the null hypothesis?
I am interested in determining which sex, male or female, is more likely to have a...
 I am interested in determining which sex, male or female, is more likely to have a tattoo. I collected data from 240 females and 215 males. 100 of the females and 67 of the males reported having at least one tattoo. I fed the data into Statistix and the following printout was produced. Hypothesis Test Two Proportions Sample Size Successes 240 100 215 67 Sample 1 Sample 2 Difference Proportion 0.41667 0.31163 0.10504 Null Hypothesis: P1 = P2 Alternative Hyp:...
Independent random samples of n1 = 120 and n2 = 120 observations were randomly selected from...
Independent random samples of n1 = 120 and n2 = 120 observations were randomly selected from binomial populations 1 and 2, respectively. Sample 1 had 62 successes, and sample 2 had 67 successes. You wish to perform a hypothesis test to determine if there is a difference in the sample proportions p1 and p2. (a) State the null and alternative hypotheses. - H0: (p1 − p2) = 0 versus Ha: (p1 − p2) ≠ 0 - H0: (p1 − p2)...
The market researchers at Barton’s pizza are interested in the proportion of male customers and female...
The market researchers at Barton’s pizza are interested in the proportion of male customers and female customers that would be willing to try a new pizza. Random samples of 176 males and 124 females were randomly selected. Responses were recorded as Yes (i.e. interested) or No (i.e. not interested) and are listed as variables MalesInterested (1) and FemalesInterested (2). The samples indicated that 91 males and 59 females respectively were interested in trying a new pizza. Test that the proportion...
Independent random samples of size n1=38 and n2=86 observations, were selected from two populations. The samples...
Independent random samples of size n1=38 and n2=86 observations, were selected from two populations. The samples from populations 1 and 2 produced x1=18 and x2=13 successes, respectively. Define p1 and p2 to be the proportion of successes in populations 1 and 2, respectively. We would like to test the following hypotheses: H0:p1=p2 versus H1:p1≠p2 (a)To test H0 versus H1, which inference procedure should you use? A. Two-sample z procedure B. One-sample z procedure C. One-sample t procedure D. Two-sample t...
Please answe before 9:30 With the recent quarantine, 30 random samples of individuals from five different...
 Please answe before 9:30
With the recent quarantine, 30 random samples of individuals from five different cities were asked how much time they had been spending per day watching TV. If it was found that the SST = 6553 and the SST = 9875, then fill out the table below (not all squares have blanks!). Whole numbered answers may be left as such, all else should be rounded to one decimal place. Mean Source DF Sum of squares F Pr>F...
Please answe before 9:30
With the recent quarantine, 30 random samples of individuals from five different cities were asked how much time they had been spending per day watching TV. If it was found that the SST = 6553 and the SST = 9875, then fill out the table below (not all squares have blanks!). Whole numbered answers may be left as such, all else should be rounded to one decimal place. Mean Source DF Sum of squares F Pr>F...
In 1941, an organization surveyed 1100 adults and asked, "Are you a total abstainer from, or...
In 1941, an organization surveyed 1100 adults and asked, "Are you a total abstainer from, or do you on occasion consume, alcoholic beverages?" Of the 1100 adults surveyed, 374 indicated that they were total abstainers. In a recent survey, the same question was asked of 1100 adults and 319 indicated that they were total abstainers. Complete parts (a) and (b) below. (a) Determine the sample proportion for each sample. The proportions of the adults who took the 1941 survey and...
In 1941, an organization surveyed 1100 adults and asked, "Are you a total abstainer from, or do y...
In 1941, an organization surveyed 1100 adults and asked, "Are you a total abstainer from, or do you on occasion consume, alcoholic beverages?" Of the 1100 adults surveyed, 374 indicated that they were total abstainers. In a recent survey, the same question was asked of 1100 adults and 319 indicated that they were total abstainers. Complete parts (a) and (b) below. (a) Determine the sample proportion for each sample. The proportions of the adults who took the 1941 survey and...
(11-13] The information below is based on independent simple random samples taken from two normally distributed...
 (11-13] The information below is based on independent simple random samples taken from two normally distributed populations having equal variances. Based on the sample information, answer the following questions about the difference between two population means. ni = 13 n2 = 12 X 1 = 51 i , = 58 S = 6 S2 = 5 11) (1 point) The parameter of interest could be: a. X1-X2 b. H1-42 C. P1-P2 d. Other, please specify: 12) (1 point) Your friend...
5. In randomized, double-blind clinical trials of a new vaccine, children were randomly divided into two...
 5. In randomized, double-blind clinical trials of a new vaccine, children were randomly divided into two groups. Subjects in group 1 received the new vaccine while subjects in group 2 received a control vaccine After the second dose, 115 of 485 subjects in the experimental group (group 1) experienced fever as a side effect. After the second dose, 106 of 574 of the subjects in the control group (group 2) experienced fever as a side effect. Does the evidence suggest...
 I am interested in determining which sex, male or female, is more likely to have a tattoo. I collected data from 240 females and 215 males. 100 of the females and 67 of the males reported having at least one tattoo. I fed the data into Statistix and the following printout was produced. Hypothesis Test Two Proportions Sample Size Successes 240 100 215 67 Sample 1 Sample 2 Difference Proportion 0.41667 0.31163 0.10504 Null Hypothesis: P1 = P2 Alternative Hyp:...
 Please answe before 9:30
With the recent quarantine, 30 random samples of individuals from five different cities were asked how much time they had been spending per day watching TV. If it was found that the SST = 6553 and the SST = 9875, then fill out the table below (not all squares have blanks!). Whole numbered answers may be left as such, all else should be rounded to one decimal place. Mean Source DF Sum of squares F Pr>F...
Please answe before 9:30
With the recent quarantine, 30 random samples of individuals from five different cities were asked how much time they had been spending per day watching TV. If it was found that the SST = 6553 and the SST = 9875, then fill out the table below (not all squares have blanks!). Whole numbered answers may be left as such, all else should be rounded to one decimal place. Mean Source DF Sum of squares F Pr>F...
 (11-13] The information below is based on independent simple random samples taken from two normally distributed populations having equal variances. Based on the sample information, answer the following questions about the difference between two population means. ni = 13 n2 = 12 X 1 = 51 i , = 58 S = 6 S2 = 5 11) (1 point) The parameter of interest could be: a. X1-X2 b. H1-42 C. P1-P2 d. Other, please specify: 12) (1 point) Your friend...
 5. In randomized, double-blind clinical trials of a new vaccine, children were randomly divided into two groups. Subjects in group 1 received the new vaccine while subjects in group 2 received a control vaccine After the second dose, 115 of 485 subjects in the experimental group (group 1) experienced fever as a side effect. After the second dose, 106 of 574 of the subjects in the control group (group 2) experienced fever as a side effect. Does the evidence suggest...
Most questions answered within 3 hours.
-
Where is the error in this code sequence?
String s1 = "Hello";
String s2 = "ello";...
asked 10 months ago -
Financial data for Joel de Paris, Inc., for last year
follow:
Joel de Paris, Inc.
Balance...
asked 10 months ago -
Consider this reaction:
Al2(SO4)3 (aq)+ BaCl3
(aq) Al2Cl6 (aq)- +
3BaSO4(s) . What is the...
asked 10 months ago -
Suppose that Savneet is considering increasing her
recent random sample from 20 car rentals to 40...
asked 10 months ago -
Trucks arrive at an unloading terminal at an average rate of 120
per hour.
Trucks arrive...
asked 10 months ago -
Why are methanol and ethanol completely soluble in water while
octanol is not very little soluble....
asked 10 months ago -
A facilities manager at a university reads in a research report
that the mean amount of...
asked 10 months ago -
When the CuSO4 is rehydrated by adding water to the anhydrous
compound, is this an endothermic...
asked 10 months ago -
A ray of sunlight is passing from diamond into crown glass; the
angle of incidence is...
asked 10 months ago -
A block of mass 0.249 kg is placed on top of a light, vertical
spring of...
asked 10 months ago -
how do the kidneys compensate in the presences of acidosis
a) trigger hyperventilate
b) reserve acid...
asked 10 months ago -
Question 501 pts
The rental rate of capital to the firm increases. Which of the
following...
asked 10 months ago