
Homework Answers
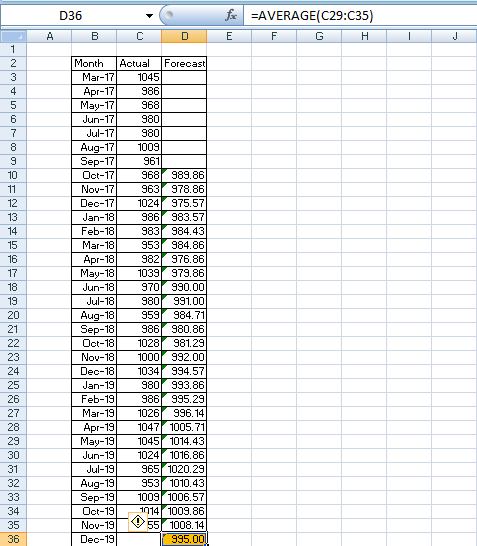
Forecast for Oct 2017 using 7 month moving average=AVERAGE(C3:C9)
(Drag this cell formula down for rest of the cells till Dec 2019)
Forecast for Dec 2019=AVERAGE(C29:C35)=995
Add Answer to:
The human resources department needs to forecast the number of employees at a site. The data...
That is the question. There's no more information I can give you about it. The information...
 That is the question. There's no more information I
can give you about it.
The information technology department needs to forecast spending on cyber security. The data for several months is supplied below. Be careful since the data is listed beginning with the most recent. The forecasting method to be used here is exponential smoothing with trend accounting for seasonality given a smoothing constant (alpha) of 0.26, a trend smoothing constant (delta) of 0.59, a previous trend amount, seasonally adjusted,...
That is the question. There's no more information I
can give you about it.
The information technology department needs to forecast spending on cyber security. The data for several months is supplied below. Be careful since the data is listed beginning with the most recent. The forecasting method to be used here is exponential smoothing with trend accounting for seasonality given a smoothing constant (alpha) of 0.26, a trend smoothing constant (delta) of 0.59, a previous trend amount, seasonally adjusted,...
Given the following history, use a three-quarter moving average to forecast the demand for the third...
Given the following history, use a three-quarter moving average to forecast the demand for the third quarter of this year. Note, the 1st quarter is Jan, Feb, and Mar; 2nd quarter Apr, May, Jun; 3rd quarter Jul, Aug, Sep; and 4th quarter Oct, Nov, Dec. JAN FEB MAR APR MAY JUN JUL AUG SEP OCT NOV DEC Last year 170 200 210 240 250 270 225 215 215 275 280 300 This year 205 210 140 255 245 220 Forecast...
If there are any seasonality or relationship between the price and the US oil price? How...
If there are any seasonality or relationship between the price and the US oil price? How to analyze? Jan-10 2.769 Jan-11 3.148 Jan-12 3.44 Jan-13 3.391 Jan-14 3.392 Feb-10 2.699 Feb-11 3.264 Feb-12 3.64 Feb-13 3.736 Feb-14 3.434 Mar-10 2.824 Mar-11 3.615 Mar-12 3.907 Mar-13 3.779 Mar-14 3.606 Apr-10 2.9 Apr-11 3.852 Apr-12 3.958 Apr-13 3.638 Apr-14 3.735 May-10 2.89 May-11 3.96 May-12 3.791 May-13 3.675 May-14 3.75 Jun-10 2.785 Jun-11 3.735 Jun-12 3.596 Jun-13 3.689 Jun-14 3.766 Jul-10 2.782...
Consider five years of monthly sales data for a company in the attached file (Q5.xlsx). a) Foreca...
 Consider five years of monthly sales data for a company in the
attached file (Q5.xlsx). a) Forecast monthly sales for the next
year (2020). (10 marks) b) Discuss whether a simple exponential
smoothing model works well with this data or not. (5 m
7 9 Month Sales 747 Feb-14 697 Mar-14 1014 Jan-14 Ap4 1126 May-14 1105 Jun-14 1450 Jul-14 1633 Aug-14 1711 Sep-14 1307 Oct-1223 Nov-14 9T5 Dec-14S53 4J-15 1024 Feb-15928 Mar-151442 7Apr-151371 May-15 1536 Ju15 2004 Jul-15 1854...
Consider five years of monthly sales data for a company in the
attached file (Q5.xlsx). a) Forecast monthly sales for the next
year (2020). (10 marks) b) Discuss whether a simple exponential
smoothing model works well with this data or not. (5 m
7 9 Month Sales 747 Feb-14 697 Mar-14 1014 Jan-14 Ap4 1126 May-14 1105 Jun-14 1450 Jul-14 1633 Aug-14 1711 Sep-14 1307 Oct-1223 Nov-14 9T5 Dec-14S53 4J-15 1024 Feb-15928 Mar-151442 7Apr-151371 May-15 1536 Ju15 2004 Jul-15 1854...
1)Given the data in the table, calculate the four period moving average forecast for unemployment...
1)Given the data in the table, calculate the four period moving average forecast for unemployment rate for October 2011. Express your result in percent, without the percent sign (e.g., 7.3 for 7.3%). Unemployment Year Month Rate (%) 2010 Oct 6.8 Nov 7.0 Dec 7.5 2011 Jan 8.0 Feb 8.2 Mar 8.5 Apr 8.6 May 8.6 Jun 8.9 Jul 9.1 Aug 8.8 Sep 8.7 Oct
Moving average (MA) Calculate the sales using 2, 3, 4, 5, and 6 month moving average...
Moving average (MA) Calculate the sales using 2, 3, 4, 5, and 6 month moving average values. Forecast and plot the upcoming period’s sales using the moving average series that fits best. Explain why you chose that particular MA. Why is it inadvisable to use the Moving Average approach to forecast far into the future? Month Sale Month Sale Month Sale Oct-12 13.30 Oct-13 24.01 Oct-14 50.56 Nov-12 1.70 Nov-13 32.67 Nov-14 60.06 Dec-12 11.44 Dec-13 23.19 Dec-14 61.73 Jan-13...
Trends Which trend line do you think best fits the following data? Plot your chosen trend...
Trends Which trend line do you think best fits the following data? Plot your chosen trend line and explain why you chose that particular type of trend line. Month Sales Month Sales Month Sales Oct-12 12.50 Oct-13 33.53 Oct-14 43.31 Nov-12 19.78 Nov-13 32.88 Nov-14 44.17 Dec-12 14.58 Dec-13 45.59 Dec-14 59.66 Jan-13 19.85 Jan-14 35.85 Jan-15 56.00 Feb-13 14.15 Feb-14 22.49 Feb-15 54.95 Mar-13 8.82 Mar-14 38.94 Mar-15 40.78 Apr-13 (3.52) Apr-14 19.90 Apr-15 42.10 May-13 10.96 May-14 16.65...
calculate the monthly time-weighted and money weighted returns for shareholders in the ADKSX with using excel....
calculate the monthly time-weighted and money weighted returns for shareholders in the ADKSX with using excel. In a text box nearby, comment on whether investors’ trading decisions have created value. Month ADKSX Return (%) ADKSX Cash Flow ($) Nov-09 3.49 -$10,648,393 Dec-09 6.93 -$618,800 Jan-10 -2.05 $940,820 Feb-10 5.74 -$2,484,437 Mar-10 5.19 -$3,699,836 Apr-10 5.48 -$1,379,757 May-10 -4.68 $2,145,936 Jun-10 -6.31 -$2,953,884 Jul-10 5.9 -$4,160,472 Aug-10 -5.18 $1,096,304 Sep-10 8.61 -$5,571,657 Oct-10 4.5 -$669,464 Nov-10 2.77 -$3,145,367 Dec-10 9.16 -$6,162,018...
Given the following data, what is the Mean Absolute Deviation (MAD): Month Demand Forecast Jan 100...
Given the following data, what is the Mean Absolute Deviation (MAD): Month Demand Forecast Jan 100 110 Feb 100 100 Mar 120 100 Apr 110 90 May 100 110 Jun 90 100 Jul 80 90 Aug 90 80 Sep 100 110 Oct 110 100 Nov 110 110 Dec 120 110 A. 10 B. 20 C. 30 D. 133.33
Calculate the sample correlation coefficient rxy. Calculate the value of the test statistic. Date Energy Healthcare...
Calculate the sample correlation coefficient rxy. Calculate the value of the test statistic. Date Energy Healthcare Jan-10 -4.87 -0.15 Feb-10 1.8 0.53 Mar-10 2.26 1.41 Apr-10 3.03 -3.75 May-10 -11.5 -5.12 Jun-10 -5.67 -0.52 Jul-10 8.73 1.49 Aug-10 -5.99 -0.97 Sep-10 10.15 8.24 Oct-10 3.89 2.28 Nov-10 2.85 -2.52 Dec-10 5.55 1.4 Jan-11 6.6 1.55 Feb-11 5.7 3.04 Mar-11 1.32 1.22 Apr-11 1.64 5.89 May-11 -4.06 2.62 Jun-11 -2.08 -0.55 Jul-11 1.14 -2.64 Aug-11 -10.41 -2.8 Sep-11 -15.06 -4.17 Oct-11...
 That is the question. There's no more information I
can give you about it.
The information technology department needs to forecast spending on cyber security. The data for several months is supplied below. Be careful since the data is listed beginning with the most recent. The forecasting method to be used here is exponential smoothing with trend accounting for seasonality given a smoothing constant (alpha) of 0.26, a trend smoothing constant (delta) of 0.59, a previous trend amount, seasonally adjusted,...
That is the question. There's no more information I
can give you about it.
The information technology department needs to forecast spending on cyber security. The data for several months is supplied below. Be careful since the data is listed beginning with the most recent. The forecasting method to be used here is exponential smoothing with trend accounting for seasonality given a smoothing constant (alpha) of 0.26, a trend smoothing constant (delta) of 0.59, a previous trend amount, seasonally adjusted,...
 Consider five years of monthly sales data for a company in the
attached file (Q5.xlsx). a) Forecast monthly sales for the next
year (2020). (10 marks) b) Discuss whether a simple exponential
smoothing model works well with this data or not. (5 m
7 9 Month Sales 747 Feb-14 697 Mar-14 1014 Jan-14 Ap4 1126 May-14 1105 Jun-14 1450 Jul-14 1633 Aug-14 1711 Sep-14 1307 Oct-1223 Nov-14 9T5 Dec-14S53 4J-15 1024 Feb-15928 Mar-151442 7Apr-151371 May-15 1536 Ju15 2004 Jul-15 1854...
Consider five years of monthly sales data for a company in the
attached file (Q5.xlsx). a) Forecast monthly sales for the next
year (2020). (10 marks) b) Discuss whether a simple exponential
smoothing model works well with this data or not. (5 m
7 9 Month Sales 747 Feb-14 697 Mar-14 1014 Jan-14 Ap4 1126 May-14 1105 Jun-14 1450 Jul-14 1633 Aug-14 1711 Sep-14 1307 Oct-1223 Nov-14 9T5 Dec-14S53 4J-15 1024 Feb-15928 Mar-151442 7Apr-151371 May-15 1536 Ju15 2004 Jul-15 1854...
Most questions answered within 3 hours.
-
Where is the error in this code sequence?
String s1 = "Hello";
String s2 = "ello";...
asked 10 months ago -
Financial data for Joel de Paris, Inc., for last year
follow:
Joel de Paris, Inc.
Balance...
asked 10 months ago -
Consider this reaction:
Al2(SO4)3 (aq)+ BaCl3
(aq) Al2Cl6 (aq)- +
3BaSO4(s) . What is the...
asked 10 months ago -
Suppose that Savneet is considering increasing her
recent random sample from 20 car rentals to 40...
asked 10 months ago -
Trucks arrive at an unloading terminal at an average rate of 120
per hour.
Trucks arrive...
asked 10 months ago -
Why are methanol and ethanol completely soluble in water while
octanol is not very little soluble....
asked 10 months ago -
A facilities manager at a university reads in a research report
that the mean amount of...
asked 10 months ago -
When the CuSO4 is rehydrated by adding water to the anhydrous
compound, is this an endothermic...
asked 10 months ago -
A ray of sunlight is passing from diamond into crown glass; the
angle of incidence is...
asked 10 months ago -
A block of mass 0.249 kg is placed on top of a light, vertical
spring of...
asked 10 months ago -
how do the kidneys compensate in the presences of acidosis
a) trigger hyperventilate
b) reserve acid...
asked 10 months ago -
Question 501 pts
The rental rate of capital to the firm increases. Which of the
following...
asked 10 months ago