
Homework Answers


Add Answer to:
Chapter 8, Section 2, Exercise 042 Consider the data with analysis shown in the following computer...
Level N Mean StDev A 6 10.300 2.700 B 5 16.800 2.168 C 4 10.800 2.387...
Level N Mean StDev A 6 10.300 2.700 B 5 16.800 2.168 C 4 10.800 2.387 Source DF SS MS F P Groups 2 132.92, 66.46, 11.02 0.002 Error 12 72.34 6.03 Total 14 205.26 What is the pooled standard deviation? What degrees of freedom are used in doing inferences for these means and differences in means? Round your answer for the pooled standard deviation to two decimal places. The pooled standard deviation is = . degrees of freedom =
Consider the data with analysis shown in the following computer output: Level N Mean StDev A...
Consider the data with analysis shown in the following computer output: Level N Mean StDev A 4 10.000 3.159 B 5 16.800 2.168 C 6 10.800 2.387 Source DF SS MS F P Groups 2 134.72 67.36 10.46 0.002 Error 12 77.23 6.44 Total 14 211.95 Is there sufficient evidence of a difference in the population means of the three groups? Yes No
ES Consider the data with analysis shown in the following computer output: Mean StDev 6 9.900...
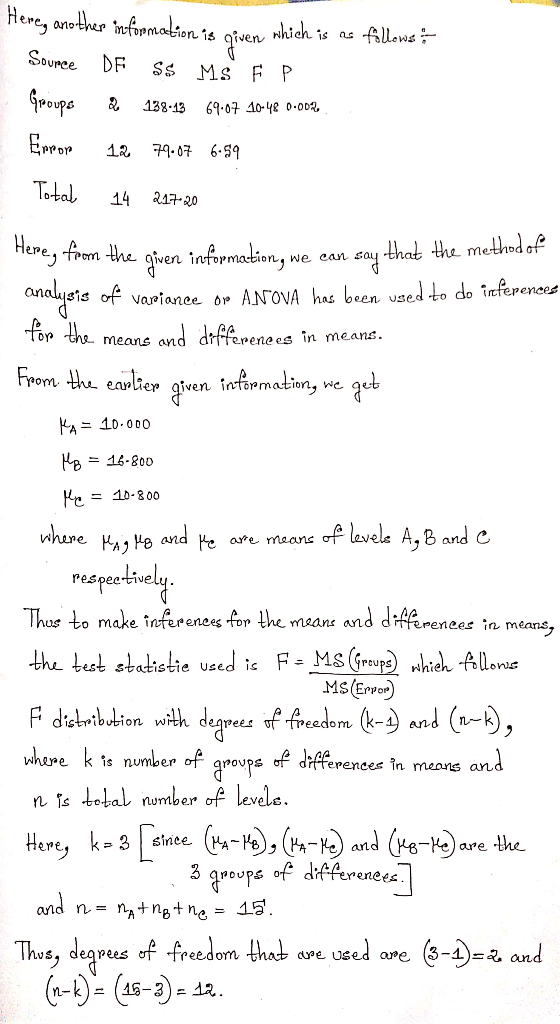
 ES Consider the data with analysis shown in the following computer output: Mean StDev 6 9.900 2.475 5 16.800 2.168 4 10.800 2.387 Source DF SS MS 2 139.86 69.93 10.74 0.002 Groups 12 78.12 6.51 Error 14 217.98 Total Is there sufficient evidence of a difference in the population means of the three groups?
5. Consider the data with analysis shown in the following computer output: Level N Mean StDev...
5. Consider the data with analysis shown in the following computer output: Level N Mean StDev A 4 10.400 2.668 B 5 16.800 2.168 C 6 10.800 2.387 Source DF SS MS F P Groups 2 126.88 63.44 11.09 0.002 Error 12 68.64 5.72 Total 14 195.52 Find a 95% confidence interval for the mean of population A. Round your answers to two decimal places.
 ES Consider the data with analysis shown in the following computer output: Mean StDev 6 9.900 2.475 5 16.800 2.168 4 10.800 2.387 Source DF SS MS 2 139.86 69.93 10.74 0.002 Groups 12 78.12 6.51 Error 14 217.98 Total Is there sufficient evidence of a difference in the population means of the three groups?
Most questions answered within 3 hours.
-
Where is the error in this code sequence?
String s1 = "Hello";
String s2 = "ello";...
asked 10 months ago -
Financial data for Joel de Paris, Inc., for last year
follow:
Joel de Paris, Inc.
Balance...
asked 10 months ago -
Consider this reaction:
Al2(SO4)3 (aq)+ BaCl3
(aq) Al2Cl6 (aq)- +
3BaSO4(s) . What is the...
asked 10 months ago -
Suppose that Savneet is considering increasing her
recent random sample from 20 car rentals to 40...
asked 10 months ago -
Trucks arrive at an unloading terminal at an average rate of 120
per hour.
Trucks arrive...
asked 10 months ago -
Why are methanol and ethanol completely soluble in water while
octanol is not very little soluble....
asked 10 months ago -
A facilities manager at a university reads in a research report
that the mean amount of...
asked 10 months ago -
When the CuSO4 is rehydrated by adding water to the anhydrous
compound, is this an endothermic...
asked 10 months ago -
A ray of sunlight is passing from diamond into crown glass; the
angle of incidence is...
asked 10 months ago -
A block of mass 0.249 kg is placed on top of a light, vertical
spring of...
asked 10 months ago -
how do the kidneys compensate in the presences of acidosis
a) trigger hyperventilate
b) reserve acid...
asked 10 months ago -
Question 501 pts
The rental rate of capital to the firm increases. Which of the
following...
asked 10 months ago