Indicate on the following graph of perfect competition: Q*, TR, TC, MR, MC, AR, AC, P,...
Indicate on the following graph of perfect competition:
Q*, TR, TC, MR, MC, AR, AC, P, π, STSP (short-term shutdown point)
and LTSP (long-term shutdown point).
Homework Answers
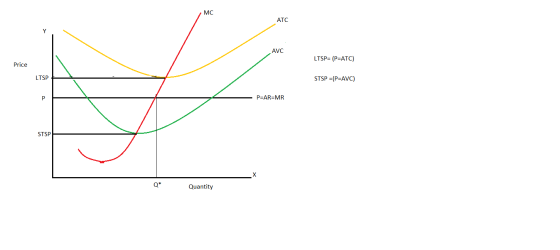
A perfectly competitive firm produces where the marginal cost equals the marginal revenue , this is where the price and the quantity are determined. The perfectly competitive firm is a price taker , they do not have any kind of market power to alther the price. If they increase their the quantity demanded will fall to zero , this makes the demand for the perfectly competitive firm perfectly elastic. So the price is equal to the marginal and the average revenue. In the short run the firm shutdown point is where the price equals the avergae variable cost , if the price goes below the average variable cost the firm should shutdown the production. In the long run, the shutdown point is where the price equals the average total cost.
 The total revenue is price multiplied by
the quantity sold.
The total revenue is price multiplied by
the quantity sold.

The total cost average total cost multiplied by the quantity.
 .
.
 The difference between the total revenue
and the total cost is the profit .
The difference between the total revenue
and the total cost is the profit .
Add Answer to:
Indicate on the following graph of perfect competition:
Q*, TR, TC, MR, MC, AR, AC, P,...
Consider a competitive rm with total costs given by TC(q) = 100 + 10q + q^2,...
Consider a competitive rm with total costs given by TC(q) = 100 + 10q + q^2, The firm faces a market price p = 50. (a) Write expressions for total revenue TR and marginal revenue MR as functions of output q. (b) Write expressions for average total cost ATC, average variable cost AVC, and marginal cost MC as functions of output q. (c) For what value of output is ATC minimized? (d) Find the profit maximizing level of output q...
Fill in the Table for a monopoly. Q P TR TC Profit MR MC 10 $20...
Fill in the Table for a monopoly. Q P TR TC Profit MR MC 10 $20 $150 11 19 155 12 18 161 13 17 170 14 16 185 39 15 15 210 What is the highest profit possible? What is the profit maximizing level of output? What is the profit maximizing price? Draw the graph for a monopoly below, find the profit maximizing level of output Q*, the profit maximizing price P*, the average total cost ATC*, the profit...
The long-run equilibrium condition for perfect competition is: a. Q = ATC = MR = MC....
 The long-run equilibrium condition for perfect competition is: a. Q = ATC = MR = MC. b. Q = AVC = MR = MC. c. P = ATC = MR = MC. d. P = AVC = MR = MC. Why do negative externalities like pollution result in inefficiency? a. Because producers will receive an unequal distribution of profits. b. Because producers artificially restrict their supply. c. Because producers manufacture more goods than people can afford to buy. d. Because...
3. Given the data below, compute TR, TC, TFC, TVC, ATC, AVC, AFC, MR, MC, AR,...
 3. Given the data below, compute TR, TC, TFC, TVC, ATC, AVC, AFC, MR, MC, AR, and Profit 1 2 3 6 7 8 9 10 11 0 TC = 10 +570 - 80+ TR = 452 - 0 50. Find the profit maximizing level of output and graph all the curves. Note: for both problems. Graph all the total curves together on one graph Graph all the average and marginal curves together on one graph Graph the profit curve...
P = 225 - q TC = 5q MC = MR MC = 5 MR =...
 P = 225 - q
TC = 5q
MC = MR
MC = 5
MR = 225 - 2q
5 = 225 - 2q
2q = 225 - 5
q = 220/2
= 110
P = 225 - 110
= 115
Duopoly Continuing with our latinum market example from last week, imagine that the government has noted the extreme restriction in latinum supplied and wishes to remedy the situation. While regulators are not willing to completely reopen the market, they...
P = 225 - q
TC = 5q
MC = MR
MC = 5
MR = 225 - 2q
5 = 225 - 2q
2q = 225 - 5
q = 220/2
= 110
P = 225 - 110
= 115
Duopoly Continuing with our latinum market example from last week, imagine that the government has noted the extreme restriction in latinum supplied and wishes to remedy the situation. While regulators are not willing to completely reopen the market, they...
P ($/pound) Q (pound) TR ($) MR ($) TC ($) MC ($) ATC ($/pound) 100 0...
P ($/pound) Q (pound) TR ($) MR ($) TC ($) MC ($) ATC ($/pound) 100 0 --- 0 --- --- 90 1 30 80 2 60 70 3 90 60 4 120 50 5 150 40 6 180 30 7 210 20 8 240 10 9 270 0 10 300 a. Complete the chart.
Q TR TC MR MC 0 0 3 - - 1 6 5 6 2 2...
Q TR TC MR MC 0 0 3 - - 1 6 5 6 2 2 12 8 3 18 12 4 24 17 5 30 23 6 36 30 7 42 38 8 48 47 TO CALCULATE MAXIMAZING LEVEL OF OUTPUT AND THEN SKETCH A GRAPH TO REPRESENT MR AND MC DATA
Consider a competitive firm with total costs given by TC(q) = 100 + 10q + q...
Consider a competitive firm with total costs given by TC(q) = 100 + 10q + q 2 The firm faces a market price p = 50. (d) Find the profit-maximizing level of output q^*. At this level of output, what are TR, TC, ATC, and π? (e) Graph the ATC, AVC, MC, and MR curves in a single graph, and indicate the profit-maximizing level of output. If there are profits, shade the region corresponding to profit and label it.
Draw a graph with MC, AVC, ATC, and P lines on it (assume perfect competition). make...
Draw a graph with MC, AVC, ATC, and P lines on it (assume perfect competition). make sure the price line is placed so the firm can make a profit. Label the price at which the firm would shutdown the price at which the firm would breakeven the profit maximizing output the profit earned
Assume TR(Q) = 150 + 500-50° and TC(Q) = 100 + 6Q Create a table in...
 Assume TR(Q) = 150 + 500-50° and TC(Q) = 100 + 6Q Create a table in Excel showing TR(Q), MR (0), TC(Q), MC (Q), π (Q), and marginal profit, as O goes from 0 to 10 in increments of 1 b. Identify the level of Q that maximizes profit. c. At the level of Q that maximizes profit, what is the relation between MR and MC? d. At the level of Q that maximizes profit, what is marginal profit? e....
 The long-run equilibrium condition for perfect competition is: a. Q = ATC = MR = MC. b. Q = AVC = MR = MC. c. P = ATC = MR = MC. d. P = AVC = MR = MC. Why do negative externalities like pollution result in inefficiency? a. Because producers will receive an unequal distribution of profits. b. Because producers artificially restrict their supply. c. Because producers manufacture more goods than people can afford to buy. d. Because...
 3. Given the data below, compute TR, TC, TFC, TVC, ATC, AVC, AFC, MR, MC, AR, and Profit 1 2 3 6 7 8 9 10 11 0 TC = 10 +570 - 80+ TR = 452 - 0 50. Find the profit maximizing level of output and graph all the curves. Note: for both problems. Graph all the total curves together on one graph Graph all the average and marginal curves together on one graph Graph the profit curve...
 P = 225 - q
TC = 5q
MC = MR
MC = 5
MR = 225 - 2q
5 = 225 - 2q
2q = 225 - 5
q = 220/2
= 110
P = 225 - 110
= 115
Duopoly Continuing with our latinum market example from last week, imagine that the government has noted the extreme restriction in latinum supplied and wishes to remedy the situation. While regulators are not willing to completely reopen the market, they...
P = 225 - q
TC = 5q
MC = MR
MC = 5
MR = 225 - 2q
5 = 225 - 2q
2q = 225 - 5
q = 220/2
= 110
P = 225 - 110
= 115
Duopoly Continuing with our latinum market example from last week, imagine that the government has noted the extreme restriction in latinum supplied and wishes to remedy the situation. While regulators are not willing to completely reopen the market, they...
 Assume TR(Q) = 150 + 500-50° and TC(Q) = 100 + 6Q Create a table in Excel showing TR(Q), MR (0), TC(Q), MC (Q), π (Q), and marginal profit, as O goes from 0 to 10 in increments of 1 b. Identify the level of Q that maximizes profit. c. At the level of Q that maximizes profit, what is the relation between MR and MC? d. At the level of Q that maximizes profit, what is marginal profit? e....
Most questions answered within 3 hours.
-
Where is the error in this code sequence?
String s1 = "Hello";
String s2 = "ello";...
asked 10 months ago -
Financial data for Joel de Paris, Inc., for last year
follow:
Joel de Paris, Inc.
Balance...
asked 10 months ago -
Consider this reaction:
Al2(SO4)3 (aq)+ BaCl3
(aq) Al2Cl6 (aq)- +
3BaSO4(s) . What is the...
asked 10 months ago -
Suppose that Savneet is considering increasing her
recent random sample from 20 car rentals to 40...
asked 10 months ago -
Trucks arrive at an unloading terminal at an average rate of 120
per hour.
Trucks arrive...
asked 10 months ago -
Why are methanol and ethanol completely soluble in water while
octanol is not very little soluble....
asked 10 months ago -
A facilities manager at a university reads in a research report
that the mean amount of...
asked 10 months ago -
When the CuSO4 is rehydrated by adding water to the anhydrous
compound, is this an endothermic...
asked 10 months ago -
A ray of sunlight is passing from diamond into crown glass; the
angle of incidence is...
asked 10 months ago -
A block of mass 0.249 kg is placed on top of a light, vertical
spring of...
asked 10 months ago -
how do the kidneys compensate in the presences of acidosis
a) trigger hyperventilate
b) reserve acid...
asked 10 months ago -
Question 501 pts
The rental rate of capital to the firm increases. Which of the
following...
asked 10 months ago