a. Explain the Chromatogram and the mass spectrum of both positive and negative ion spectrum by identifying the compound?
.

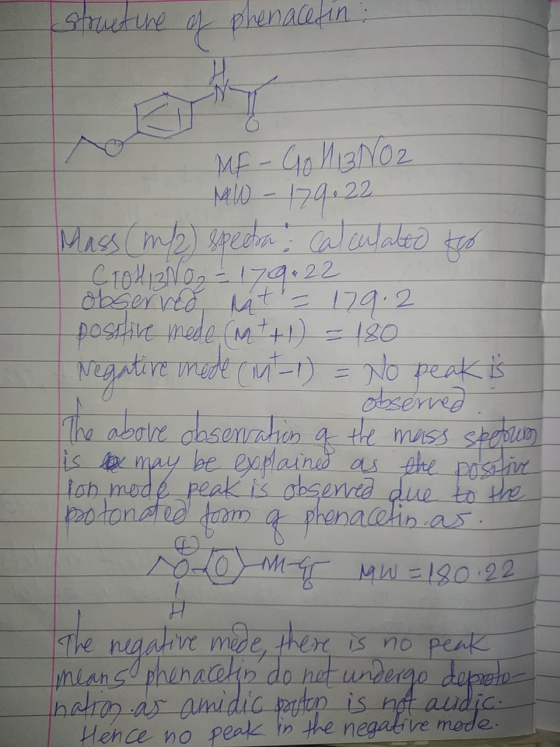
B. In negative ion Mass why is there no
peak?

Hint: its phenacetin, please explain how it is
phenacetin with full explanation and reference.

Homework Answers
The positve and negative ion mode in the mass spectrum is best explained due to the protonated form for the positve mode and the deprotonated form is for the negative mode. The structural feature of the phenacetin is self explanarory for the not having the peak at negative mode as the amide group present in the phenacetin do not deprotonated by base/alkali therefor no peak in the negative mode in the mass spectrum.
The detals have been explained as below.
Add Answer to:
a. Explain the Chromatogram and the mass spectrum of
both positive and negative ion spectrum by...
Describe the fragments and their formula of this compound. Please let me know the fragment for...
 Describe the fragments and their formula of this
compound. Please let me know the fragment for peak 53 and peak 147
respectively
This is a spectra from GC-MS of Phenacetin
Abundance Average of 9.548 to 9.657 min. 20Jan 20RND.Didata.me 179.2 3500000 3000000 108.1 2500000, 2000000- 1500000 1000000- 500000 53 50 213.2 200 258. 250 3.18.1 355 1 389.4 429. 300 350 400 100 150
Describe the fragments and their formula of this
compound. Please let me know the fragment for peak 53 and peak 147
respectively
This is a spectra from GC-MS of Phenacetin
Abundance Average of 9.548 to 9.657 min. 20Jan 20RND.Didata.me 179.2 3500000 3000000 108.1 2500000, 2000000- 1500000 1000000- 500000 53 50 213.2 200 258. 250 3.18.1 355 1 389.4 429. 300 350 400 100 150
GCMS Data: Briefly discuss how the GC-MS supports the identity of the product. In your discussion...
 GCMS Data: Briefly discuss how the GC-MS supports the identity of the product. In your discussion of the GC-MS data, include: a) the molecular ion M* and its corresponding m/z value from the spectrum; b) the base peak (i.e. the peak with highest abundance) and its corresponding m/z. Explain how the GC-MS data allow you to tell whether the reaction was successful or not. In your discussion, include things such as (but not limited to): presence of any major impurities,...
The following GCMS spectrum was of the product of a Grignard reaction between phenylmagnesium bromide and...
 The following GCMS spectrum was of the product of a Grignard
reaction between phenylmagnesium bromide and acetophenone in
anhydrous conditions. The major peak in the chromatogram was
1,1-diphenylethanol. I was able to identify that peak and its
fragmentation. However, I cannot figure out the identity of the
second peak in the chromatogram (around 9 minutes). I have attached
this mass spec in the post below, and I appreciate any help in
determining its identity and fragmentation.
le Name: CM 227...
The following GCMS spectrum was of the product of a Grignard
reaction between phenylmagnesium bromide and acetophenone in
anhydrous conditions. The major peak in the chromatogram was
1,1-diphenylethanol. I was able to identify that peak and its
fragmentation. However, I cannot figure out the identity of the
second peak in the chromatogram (around 9 minutes). I have attached
this mass spec in the post below, and I appreciate any help in
determining its identity and fragmentation.
le Name: CM 227...
On the GC-MS Spectrum i have to do this. here is the reaction
 on the GC-MS Spectrum i have to do this.
here is the reaction
On the GC-MS spectra, what is the key piece of information that illustrates that you most likely made your desired product? Be specific. Answer in one sentence. 9. 10. One of the most frequently made fragments has a m/z 121. In box 1, draw a picture of this fragment. In box stable. Two hints to help you with Box 2: 1) Every atom in Box 2 MUST...
on the GC-MS Spectrum i have to do this.
here is the reaction
On the GC-MS spectra, what is the key piece of information that illustrates that you most likely made your desired product? Be specific. Answer in one sentence. 9. 10. One of the most frequently made fragments has a m/z 121. In box 1, draw a picture of this fragment. In box stable. Two hints to help you with Box 2: 1) Every atom in Box 2 MUST...
Hi there. I am super confused and thought that this molecule was a cinnamyl ester as...
 Hi there. I am super confused and thought that this molecule was
a cinnamyl ester as shown here.
This does not seem to match up with the mass spectroscopy, but
it does seem to match with NMR. Can someone please teach me what I
am missing? I've included all data below.
i
just need to identify what molecule this is because the molecular
weight does not match. Thanks!
он O0 6 ppm 7.5 7.0 6.5 6.0 5.5 5.0 4.5 4.0...
Hi there. I am super confused and thought that this molecule was
a cinnamyl ester as shown here.
This does not seem to match up with the mass spectroscopy, but
it does seem to match with NMR. Can someone please teach me what I
am missing? I've included all data below.
i
just need to identify what molecule this is because the molecular
weight does not match. Thanks!
он O0 6 ppm 7.5 7.0 6.5 6.0 5.5 5.0 4.5 4.0...
I am not understanding this assignment at all. Any assistance is very much appreciated. Mass Spectrum: Molecular Ion m/z value and structure of the Molecular Ion. Base Peak m/z value and structure of...
 I am not understanding this assignment at all. Any assistance is
very much appreciated.
Mass Spectrum:
Molecular Ion m/z value and structure of the Molecular Ion.
Base Peak m/z value and structure of that ion
One other significant peak m/z value and structure of that
ion
C13 NMR Spectrum-- Draw Structure of Compound
on the C13 NMR spectrum and identify each signal with the
appropriate Carbon.
Proton NMR Spectrum-- Draw Structure of
Compound on the Proton NMR spectrum and identify...
I am not understanding this assignment at all. Any assistance is
very much appreciated.
Mass Spectrum:
Molecular Ion m/z value and structure of the Molecular Ion.
Base Peak m/z value and structure of that ion
One other significant peak m/z value and structure of that
ion
C13 NMR Spectrum-- Draw Structure of Compound
on the C13 NMR spectrum and identify each signal with the
appropriate Carbon.
Proton NMR Spectrum-- Draw Structure of
Compound on the Proton NMR spectrum and identify...
 Describe the fragments and their formula of this
compound. Please let me know the fragment for peak 53 and peak 147
respectively
This is a spectra from GC-MS of Phenacetin
Abundance Average of 9.548 to 9.657 min. 20Jan 20RND.Didata.me 179.2 3500000 3000000 108.1 2500000, 2000000- 1500000 1000000- 500000 53 50 213.2 200 258. 250 3.18.1 355 1 389.4 429. 300 350 400 100 150
Describe the fragments and their formula of this
compound. Please let me know the fragment for peak 53 and peak 147
respectively
This is a spectra from GC-MS of Phenacetin
Abundance Average of 9.548 to 9.657 min. 20Jan 20RND.Didata.me 179.2 3500000 3000000 108.1 2500000, 2000000- 1500000 1000000- 500000 53 50 213.2 200 258. 250 3.18.1 355 1 389.4 429. 300 350 400 100 150
 GCMS Data: Briefly discuss how the GC-MS supports the identity of the product. In your discussion of the GC-MS data, include: a) the molecular ion M* and its corresponding m/z value from the spectrum; b) the base peak (i.e. the peak with highest abundance) and its corresponding m/z. Explain how the GC-MS data allow you to tell whether the reaction was successful or not. In your discussion, include things such as (but not limited to): presence of any major impurities,...
 The following GCMS spectrum was of the product of a Grignard
reaction between phenylmagnesium bromide and acetophenone in
anhydrous conditions. The major peak in the chromatogram was
1,1-diphenylethanol. I was able to identify that peak and its
fragmentation. However, I cannot figure out the identity of the
second peak in the chromatogram (around 9 minutes). I have attached
this mass spec in the post below, and I appreciate any help in
determining its identity and fragmentation.
le Name: CM 227...
The following GCMS spectrum was of the product of a Grignard
reaction between phenylmagnesium bromide and acetophenone in
anhydrous conditions. The major peak in the chromatogram was
1,1-diphenylethanol. I was able to identify that peak and its
fragmentation. However, I cannot figure out the identity of the
second peak in the chromatogram (around 9 minutes). I have attached
this mass spec in the post below, and I appreciate any help in
determining its identity and fragmentation.
le Name: CM 227...
 on the GC-MS Spectrum i have to do this.
here is the reaction
On the GC-MS spectra, what is the key piece of information that illustrates that you most likely made your desired product? Be specific. Answer in one sentence. 9. 10. One of the most frequently made fragments has a m/z 121. In box 1, draw a picture of this fragment. In box stable. Two hints to help you with Box 2: 1) Every atom in Box 2 MUST...
on the GC-MS Spectrum i have to do this.
here is the reaction
On the GC-MS spectra, what is the key piece of information that illustrates that you most likely made your desired product? Be specific. Answer in one sentence. 9. 10. One of the most frequently made fragments has a m/z 121. In box 1, draw a picture of this fragment. In box stable. Two hints to help you with Box 2: 1) Every atom in Box 2 MUST...
 Hi there. I am super confused and thought that this molecule was
a cinnamyl ester as shown here.
This does not seem to match up with the mass spectroscopy, but
it does seem to match with NMR. Can someone please teach me what I
am missing? I've included all data below.
i
just need to identify what molecule this is because the molecular
weight does not match. Thanks!
он O0 6 ppm 7.5 7.0 6.5 6.0 5.5 5.0 4.5 4.0...
Hi there. I am super confused and thought that this molecule was
a cinnamyl ester as shown here.
This does not seem to match up with the mass spectroscopy, but
it does seem to match with NMR. Can someone please teach me what I
am missing? I've included all data below.
i
just need to identify what molecule this is because the molecular
weight does not match. Thanks!
он O0 6 ppm 7.5 7.0 6.5 6.0 5.5 5.0 4.5 4.0...
 I am not understanding this assignment at all. Any assistance is
very much appreciated.
Mass Spectrum:
Molecular Ion m/z value and structure of the Molecular Ion.
Base Peak m/z value and structure of that ion
One other significant peak m/z value and structure of that
ion
C13 NMR Spectrum-- Draw Structure of Compound
on the C13 NMR spectrum and identify each signal with the
appropriate Carbon.
Proton NMR Spectrum-- Draw Structure of
Compound on the Proton NMR spectrum and identify...
I am not understanding this assignment at all. Any assistance is
very much appreciated.
Mass Spectrum:
Molecular Ion m/z value and structure of the Molecular Ion.
Base Peak m/z value and structure of that ion
One other significant peak m/z value and structure of that
ion
C13 NMR Spectrum-- Draw Structure of Compound
on the C13 NMR spectrum and identify each signal with the
appropriate Carbon.
Proton NMR Spectrum-- Draw Structure of
Compound on the Proton NMR spectrum and identify...
Most questions answered within 3 hours.
-
Where is the error in this code sequence?
String s1 = "Hello";
String s2 = "ello";...
asked 10 months ago -
Financial data for Joel de Paris, Inc., for last year
follow:
Joel de Paris, Inc.
Balance...
asked 10 months ago -
Consider this reaction:
Al2(SO4)3 (aq)+ BaCl3
(aq) Al2Cl6 (aq)- +
3BaSO4(s) . What is the...
asked 10 months ago -
Suppose that Savneet is considering increasing her
recent random sample from 20 car rentals to 40...
asked 10 months ago -
Trucks arrive at an unloading terminal at an average rate of 120
per hour.
Trucks arrive...
asked 10 months ago -
Why are methanol and ethanol completely soluble in water while
octanol is not very little soluble....
asked 10 months ago -
A facilities manager at a university reads in a research report
that the mean amount of...
asked 10 months ago -
When the CuSO4 is rehydrated by adding water to the anhydrous
compound, is this an endothermic...
asked 10 months ago -
A ray of sunlight is passing from diamond into crown glass; the
angle of incidence is...
asked 10 months ago -
A block of mass 0.249 kg is placed on top of a light, vertical
spring of...
asked 10 months ago -
how do the kidneys compensate in the presences of acidosis
a) trigger hyperventilate
b) reserve acid...
asked 10 months ago -
Question 501 pts
The rental rate of capital to the firm increases. Which of the
following...
asked 10 months ago