
Homework Answers


Add Answer to:
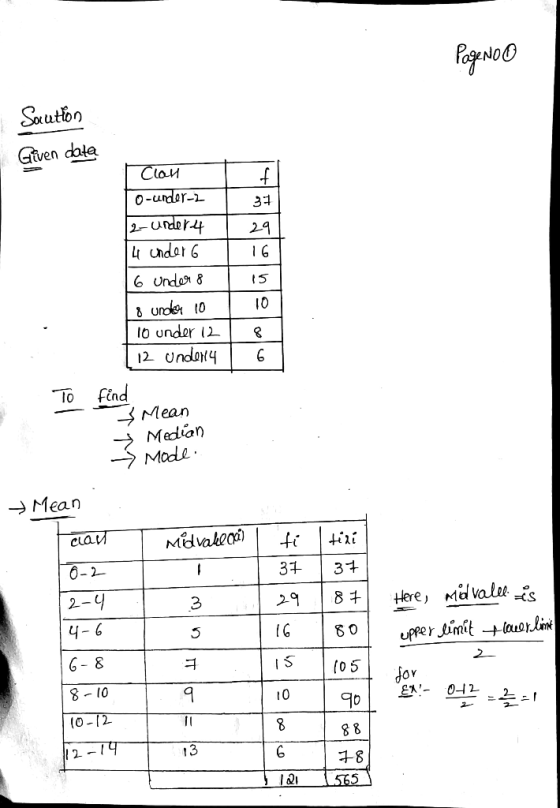
Sec 3, Question 3.27 Compute the mean, the median, and the mode for the following data....
B. Compute the mean, median and mode for the following data set. When necessary round your...
 B. Compute the mean, median and mode for the following data set. When necessary round your answer to the nearest tenth. 13 17 813 8 13 Mean Median Mode 15 points Save Answer
Find the mean, median and mode of the following distributions. Do not round answrs to whole...
 Find the mean, median and mode of the following distributions. Do not round answrs to whole numbers. 28 16 36 16 30 22 1. mean 2. median 3. mode B. X 52 51 50 49 48 47 4 6 4. mean 5. median 6. mode 3 2 4 c.x 7. median interval 8. modal interval 60-69 4 50-59 4 40-49 12 30-39 11 20-29 11 10-19 5 0-94
Find the mean, median, mode, population standard deviation and variance of the given data: Items 3...
 Find the mean, median, mode, population standard deviation and variance of the given data: Items 3 5 6 9 10 12 15 Frequency 1 4 2 12 5 4 2 Mean=9.03 Median= 9 Mode 9 Population standard= 4 Variance= 16 Mean=9,03 Median= 9 Mode- 9 Population standard deviation=5 Variance= 25 Mean=9.03 Median= 9 Mode= 9 Population standard deviation= 6 Variance= 36 Mean=9.03 Median= 9 Mode= 9 Population standard deviation=2.8 Variance= 7.7
2. Compute the mean, median, and mode for the following three sets of scores saved as...
2. Compute the mean, median, and mode for the following three sets of scores saved as Chapter 2 Data Set 2 in the appendix. Do it by hand or use a computer program such as SPSS. Show your work, and if you use SPSS, print out a copy of the output. Score 1 Score 2 Score 3 3 34 154 7 54 167 5 17 132 4 26 145 5 34 154 6 25 145 7 14 113 8 24 ...
Calculate the mean, median, mode, range and standard deviation of the data: -5, -3, -3, 4,9...
 Calculate the mean, median, mode, range and standard deviation of the data: -5, -3, -3, 4,9 a) mean 1.8, median-3, mode 3, range 14, standard deviation 5.7 b) mean 0.4, median 4, mode--5, range 15, standard deviation 5.9 c) mean-1.8, median--5, mode--3, range 13, standard deviation 5.7 d) mean 0.4, median-3, mode3, range 14, standard deviation 5.9 e) None of the above Question 9 Calculate the mean, median, mode, range and standard deviation of the data: -120, -45, -45, 14,...
Which of the following choices best describes the location of the median of the data represented...
 Which of the following choices best describes the location of the median of the data represented by thi frequency distribution? More than one choice is possible. 14 12 10 8 6 4 2 0 4 6 00 10 12 14 The median of the data represented by this frequency distribution is located to the left of its mean. The median of the data represented by this frequency distribution is located to the left of the mode, The median value is...
Find the mean, median, and mode of the data, if possible. If any of these measures...
 Find the mean, median, and mode of the data, if possible. If any of these measures cannot be found or a measure does not represent the center of the data, explain why The durations (in minutes) of power failures at a residence in the last 6 years are listed below. 71 46 111 22 111 67 67 16 58 38 What is the mean duration? Select the correct choſce below and fill in any answer box to complete your choice....
Find the (a) mean, (b) median, (c) mode, and (d) midrange for the data and then...
 Find the (a) mean, (b) median, (c) mode, and (d) midrange for the data and then (e) answer the given question. Listed below are foot lengths in inches of randomly selected women in a study of a country's military in 1988. Are the statistics representative of the current population of all women in that country's military? 8.6 9.4 8.7 9.4 9.5 9.7 9.0 9.3 9.1 8.7 8.7 a. Find the mean. The mean is □ inches). (Type an integer or...
Find the mean, median, and mode of the data, if possible. If any of these measures...
 Find the mean, median, and mode of the data, if possible. If any of these measures cannot be found or a measure does not represent the center of the data, explain why. The durations (in minutes) of power failures at a residence in the last 3 years are listed below. 39 What is the mean duration? Select the correct choice below and fill in any answer box to complete your choice. 42 51 16 39 83 62 24 16 119...
Page 10 of 16 Previous Save and complete later Next S027101fr Compute the Mean, Median, and...
 Page 10 of 16 Previous Save and complete later Next S027101fr Compute the Mean, Median, and Mode of the following grouped frequency table. (Round the answers upto 1 decimal places) Claver 10-20 20-30 30 - 40 40-50 50-6060-70 Frequency 8 11 9 15 7 10 Mean Median 1 2 3 4 Delete 2922 Back 900 Clear Mode Done
 B. Compute the mean, median and mode for the following data set. When necessary round your answer to the nearest tenth. 13 17 813 8 13 Mean Median Mode 15 points Save Answer
 Find the mean, median and mode of the following distributions. Do not round answrs to whole numbers. 28 16 36 16 30 22 1. mean 2. median 3. mode B. X 52 51 50 49 48 47 4 6 4. mean 5. median 6. mode 3 2 4 c.x 7. median interval 8. modal interval 60-69 4 50-59 4 40-49 12 30-39 11 20-29 11 10-19 5 0-94
 Find the mean, median, mode, population standard deviation and variance of the given data: Items 3 5 6 9 10 12 15 Frequency 1 4 2 12 5 4 2 Mean=9.03 Median= 9 Mode 9 Population standard= 4 Variance= 16 Mean=9,03 Median= 9 Mode- 9 Population standard deviation=5 Variance= 25 Mean=9.03 Median= 9 Mode= 9 Population standard deviation= 6 Variance= 36 Mean=9.03 Median= 9 Mode= 9 Population standard deviation=2.8 Variance= 7.7
 Calculate the mean, median, mode, range and standard deviation of the data: -5, -3, -3, 4,9 a) mean 1.8, median-3, mode 3, range 14, standard deviation 5.7 b) mean 0.4, median 4, mode--5, range 15, standard deviation 5.9 c) mean-1.8, median--5, mode--3, range 13, standard deviation 5.7 d) mean 0.4, median-3, mode3, range 14, standard deviation 5.9 e) None of the above Question 9 Calculate the mean, median, mode, range and standard deviation of the data: -120, -45, -45, 14,...
 Which of the following choices best describes the location of the median of the data represented by thi frequency distribution? More than one choice is possible. 14 12 10 8 6 4 2 0 4 6 00 10 12 14 The median of the data represented by this frequency distribution is located to the left of its mean. The median of the data represented by this frequency distribution is located to the left of the mode, The median value is...
 Find the mean, median, and mode of the data, if possible. If any of these measures cannot be found or a measure does not represent the center of the data, explain why The durations (in minutes) of power failures at a residence in the last 6 years are listed below. 71 46 111 22 111 67 67 16 58 38 What is the mean duration? Select the correct choſce below and fill in any answer box to complete your choice....
 Find the (a) mean, (b) median, (c) mode, and (d) midrange for the data and then (e) answer the given question. Listed below are foot lengths in inches of randomly selected women in a study of a country's military in 1988. Are the statistics representative of the current population of all women in that country's military? 8.6 9.4 8.7 9.4 9.5 9.7 9.0 9.3 9.1 8.7 8.7 a. Find the mean. The mean is □ inches). (Type an integer or...
 Find the mean, median, and mode of the data, if possible. If any of these measures cannot be found or a measure does not represent the center of the data, explain why. The durations (in minutes) of power failures at a residence in the last 3 years are listed below. 39 What is the mean duration? Select the correct choice below and fill in any answer box to complete your choice. 42 51 16 39 83 62 24 16 119...
 Page 10 of 16 Previous Save and complete later Next S027101fr Compute the Mean, Median, and Mode of the following grouped frequency table. (Round the answers upto 1 decimal places) Claver 10-20 20-30 30 - 40 40-50 50-6060-70 Frequency 8 11 9 15 7 10 Mean Median 1 2 3 4 Delete 2922 Back 900 Clear Mode Done
Most questions answered within 3 hours.
-
Where is the error in this code sequence?
String s1 = "Hello";
String s2 = "ello";...
asked 10 months ago -
Financial data for Joel de Paris, Inc., for last year
follow:
Joel de Paris, Inc.
Balance...
asked 10 months ago -
Consider this reaction:
Al2(SO4)3 (aq)+ BaCl3
(aq) Al2Cl6 (aq)- +
3BaSO4(s) . What is the...
asked 10 months ago -
Suppose that Savneet is considering increasing her
recent random sample from 20 car rentals to 40...
asked 10 months ago -
Trucks arrive at an unloading terminal at an average rate of 120
per hour.
Trucks arrive...
asked 10 months ago -
Why are methanol and ethanol completely soluble in water while
octanol is not very little soluble....
asked 10 months ago -
A facilities manager at a university reads in a research report
that the mean amount of...
asked 10 months ago -
When the CuSO4 is rehydrated by adding water to the anhydrous
compound, is this an endothermic...
asked 10 months ago -
A ray of sunlight is passing from diamond into crown glass; the
angle of incidence is...
asked 10 months ago -
A block of mass 0.249 kg is placed on top of a light, vertical
spring of...
asked 10 months ago -
how do the kidneys compensate in the presences of acidosis
a) trigger hyperventilate
b) reserve acid...
asked 10 months ago -
Question 501 pts
The rental rate of capital to the firm increases. Which of the
following...
asked 10 months ago