Please dont answer by hand writing and show steps clearly. Thank you
Homework Answers
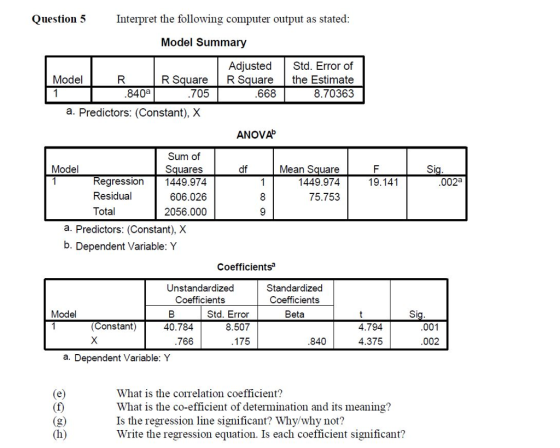
a) the correlation coefficients is nothing but R which is 0.840.
b)the coefficient of determination is R2= 0.705, which means 70.5% of the variation of the dependent variable(Y) is explained by the independent variable(X).
c)Yes, because in the ANOVA table, p-value = 0.002, which is very small. hence, we can conclude that at 0.01 level of significance, the regression line is significant.
d)the regression equation is,
 = 40.784+0.766X
Yes, both the coefficients are significant since p-value for both the coefficients is 0.001 and 0.002 which are significant.
Add Answer to:
Please dont answer by hand writing and show steps clearly. Thank
you
Question 5 Interpret the...
From the three three Regression tests, come up with three hypotheses. Regression Method Variables Entered/Removeda Variables...
 From the three three Regression tests, come up with three
hypotheses.
Regression Method Variables Entered/Removeda Variables Model Variables Entered Removed 1 TotElectb a. Dependent Variable: Variety Seeking b. All requested variables entered. Enter Model Summary Adjusted R R Square Square .009 .002 Model R Std. Error of the Estimate .64205 1 .0958 a. Predictors: (Constant), TotElect Coefficients a Standardized Coefficients Model Unstandardized Coefficients B Std. Error 3.667 . 108 Beta t Sig. .000 1 (Constant) 34.075 TotElect .008 .007 .095...
From the three three Regression tests, come up with three
hypotheses.
Regression Method Variables Entered/Removeda Variables Model Variables Entered Removed 1 TotElectb a. Dependent Variable: Variety Seeking b. All requested variables entered. Enter Model Summary Adjusted R R Square Square .009 .002 Model R Std. Error of the Estimate .64205 1 .0958 a. Predictors: (Constant), TotElect Coefficients a Standardized Coefficients Model Unstandardized Coefficients B Std. Error 3.667 . 108 Beta t Sig. .000 1 (Constant) 34.075 TotElect .008 .007 .095...
A researcher uses two regression models to seek answers to two research questions. These models a...
 A researcher uses two
regression models to seek answers to two research questions. These
models are:
Y1 = Bo1 + B11X1
Y2 = Bo2 + B12X1 + B22X12
Test the null hypotheses for both models. Use the results of
your analyses to recommend an appropriate model. In each of the
above two cases, state your null and alternative hypotheses,
decision criteria, decision and conclusion.
The level of significance is 5%. The data for this study are
presented in the table...
A researcher uses two
regression models to seek answers to two research questions. These
models are:
Y1 = Bo1 + B11X1
Y2 = Bo2 + B12X1 + B22X12
Test the null hypotheses for both models. Use the results of
your analyses to recommend an appropriate model. In each of the
above two cases, state your null and alternative hypotheses,
decision criteria, decision and conclusion.
The level of significance is 5%. The data for this study are
presented in the table...
Models 1-7 are below Part C: Select one model you would use to explain reading ability.,Then use that model to find the 95% confidence interval estimate for the mean reading ability 95% p...
 Models 1-7 are below
Part C: Select one model you would use to explain reading ability.,Then use that model to find the 95% confidence interval estimate for the mean reading ability 95% prediction interval for reading ability When age 6, mem span 4.2 and ig 91. Regression [DataSetll C:\Usersn.little5773 Downloads\child data.sav Variables Entered/Removed Variables Entered Variables Removed Method Model Enter age a. Dependent Variable: reading ability b. All requested variables entered. Model Summary Adjusted R Square Std. Error o R...
Models 1-7 are below
Part C: Select one model you would use to explain reading ability.,Then use that model to find the 95% confidence interval estimate for the mean reading ability 95% prediction interval for reading ability When age 6, mem span 4.2 and ig 91. Regression [DataSetll C:\Usersn.little5773 Downloads\child data.sav Variables Entered/Removed Variables Entered Variables Removed Method Model Enter age a. Dependent Variable: reading ability b. All requested variables entered. Model Summary Adjusted R Square Std. Error o R...
Investigate the relationship between the respondent’s education (EDUC) and the education received...
 Investigate the relationship
between the respondent’s education (EDUC) and the education
received by his or her father and mother (PAEDUC and MAEDUC,
respectively). Calculate the correlation coefficient, the
coefficient of determination, and the regression equation
predicting the respondent’s education with father’s education only.
Interpret your results. Determine the multiple correlation
coefficient, the multiple coefficient of determination, and the
regression equation predicting the respondent’s education with
father’s and mother’s education. Interpret your results. Did taking
into account the respondent’s mother’s education...
Investigate the relationship
between the respondent’s education (EDUC) and the education
received by his or her father and mother (PAEDUC and MAEDUC,
respectively). Calculate the correlation coefficient, the
coefficient of determination, and the regression equation
predicting the respondent’s education with father’s education only.
Interpret your results. Determine the multiple correlation
coefficient, the multiple coefficient of determination, and the
regression equation predicting the respondent’s education with
father’s and mother’s education. Interpret your results. Did taking
into account the respondent’s mother’s education...
Model Summary Adjusted R Square Std. Error of the Estimate Model R R Square 1 .843a...
 Model Summary Adjusted R Square Std. Error of the Estimate Model R R Square 1 .843a .711 .707 7.812812 a. Predictors: (Constant), Fuel efficiency, Horsepower Coefficientsa Standardized Coefficients Beta Sig 2.354 .020 Unstandardized Coefficients Model B Std. Error 1 (Constant) 28.144 11.954 Horsepower 229 .013 Length - 219 Fuel efficiency -.090 .185 a. Dependent Variable: Price in thousands .906 16.989 ,000 .050 - 205 -4.348 .000 -.027 -.488 .627 Model Summary Adjusted R Square Std. Error of the Estimate Model...
Overview of the Study: The data are based on a Comprehensive School Reform (CSR) Initiative that...
Overview of the Study: The data are based on a Comprehensive School Reform (CSR) Initiative that focused on the improvement of reading and writing for students in the primary grade. The school received a grant from the state which was used to strengthen classroom teachers’ instructional skills. The regression outputs present information for students in the school. Description of the variables: Please use the following description/coding to help you in your analyses. Gender: female; 1 male=0 Coding – Gender female...
The following questions refer to the output shown below. Researchers used temperature to predict failure time...
 The following questions refer to the output shown below.
Researchers used temperature to predict failure time for a
superconductive material with the following
a. Write the regression equation based on the results shown
below.
b. Assess the model utility.
linear model: yˆ = β0 + β1xtemp
Write the regression equation based on the results shown
below.
Would you recommend the model? Why or why not?
Model Summary Adjusted R Model R R Square Square .918a .843 .835 a. Predictors: (Constant),...
The following questions refer to the output shown below.
Researchers used temperature to predict failure time for a
superconductive material with the following
a. Write the regression equation based on the results shown
below.
b. Assess the model utility.
linear model: yˆ = β0 + β1xtemp
Write the regression equation based on the results shown
below.
Would you recommend the model? Why or why not?
Model Summary Adjusted R Model R R Square Square .918a .843 .835 a. Predictors: (Constant),...
please help with step by step calculations Variables Entered/Removed Variables Removed Model Variables Entered) Method contraception...
 please help with step by step calculations
Variables Entered/Removed Variables Removed Model Variables Entered) Method contraception use (%) Enter a. All requested variables entered. b. Dependent Variable: fertility rate per woman Model Summary Std. Error of the Estimate Model R .71764 Adjusted R2 Square .469 220 168 a. Predictors: (Constant), contraception use %) ANOVA Model Sum of Squares Idf Regression 2.177 Residual 7.725 Total 9.902 Mean Square 2.177 .515 a. Predictors: (Constant), contraception use (%) b. Dependent Variable: fertility rate...
please help with step by step calculations
Variables Entered/Removed Variables Removed Model Variables Entered) Method contraception use (%) Enter a. All requested variables entered. b. Dependent Variable: fertility rate per woman Model Summary Std. Error of the Estimate Model R .71764 Adjusted R2 Square .469 220 168 a. Predictors: (Constant), contraception use %) ANOVA Model Sum of Squares Idf Regression 2.177 Residual 7.725 Total 9.902 Mean Square 2.177 .515 a. Predictors: (Constant), contraception use (%) b. Dependent Variable: fertility rate...
QUESTION 6 Model Summary Model R R Square Adjusted R Square Std. Error of the Estimate...
QUESTION 6 Model Summary Model R R Square Adjusted R Square Std. Error of the Estimate 1 .641a .410 .406 4.507 a. Predictors: (Constant), age 3 groups, Total Mastery, Total Optimism Coefficientsa Model Unstandardized Coefficients Standardized Coefficients t Sig. B Std. Error Beta 1 (Constant) 50.016 1.409 35.508 .000 Total Mastery -.786 .067 -.526 -11.719 .000 Total Optimism -.217 .060 -.164 -3.623 .000 age 3 groups -.712 .275 -.098 -2.588 .010 a. Dependent Variable: Total perceived stress What proportion of...
 From the three three Regression tests, come up with three
hypotheses.
Regression Method Variables Entered/Removeda Variables Model Variables Entered Removed 1 TotElectb a. Dependent Variable: Variety Seeking b. All requested variables entered. Enter Model Summary Adjusted R R Square Square .009 .002 Model R Std. Error of the Estimate .64205 1 .0958 a. Predictors: (Constant), TotElect Coefficients a Standardized Coefficients Model Unstandardized Coefficients B Std. Error 3.667 . 108 Beta t Sig. .000 1 (Constant) 34.075 TotElect .008 .007 .095...
From the three three Regression tests, come up with three
hypotheses.
Regression Method Variables Entered/Removeda Variables Model Variables Entered Removed 1 TotElectb a. Dependent Variable: Variety Seeking b. All requested variables entered. Enter Model Summary Adjusted R R Square Square .009 .002 Model R Std. Error of the Estimate .64205 1 .0958 a. Predictors: (Constant), TotElect Coefficients a Standardized Coefficients Model Unstandardized Coefficients B Std. Error 3.667 . 108 Beta t Sig. .000 1 (Constant) 34.075 TotElect .008 .007 .095...
 A researcher uses two
regression models to seek answers to two research questions. These
models are:
Y1 = Bo1 + B11X1
Y2 = Bo2 + B12X1 + B22X12
Test the null hypotheses for both models. Use the results of
your analyses to recommend an appropriate model. In each of the
above two cases, state your null and alternative hypotheses,
decision criteria, decision and conclusion.
The level of significance is 5%. The data for this study are
presented in the table...
A researcher uses two
regression models to seek answers to two research questions. These
models are:
Y1 = Bo1 + B11X1
Y2 = Bo2 + B12X1 + B22X12
Test the null hypotheses for both models. Use the results of
your analyses to recommend an appropriate model. In each of the
above two cases, state your null and alternative hypotheses,
decision criteria, decision and conclusion.
The level of significance is 5%. The data for this study are
presented in the table...
 Models 1-7 are below
Part C: Select one model you would use to explain reading ability.,Then use that model to find the 95% confidence interval estimate for the mean reading ability 95% prediction interval for reading ability When age 6, mem span 4.2 and ig 91. Regression [DataSetll C:\Usersn.little5773 Downloads\child data.sav Variables Entered/Removed Variables Entered Variables Removed Method Model Enter age a. Dependent Variable: reading ability b. All requested variables entered. Model Summary Adjusted R Square Std. Error o R...
Models 1-7 are below
Part C: Select one model you would use to explain reading ability.,Then use that model to find the 95% confidence interval estimate for the mean reading ability 95% prediction interval for reading ability When age 6, mem span 4.2 and ig 91. Regression [DataSetll C:\Usersn.little5773 Downloads\child data.sav Variables Entered/Removed Variables Entered Variables Removed Method Model Enter age a. Dependent Variable: reading ability b. All requested variables entered. Model Summary Adjusted R Square Std. Error o R...
 Investigate the relationship
between the respondent’s education (EDUC) and the education
received by his or her father and mother (PAEDUC and MAEDUC,
respectively). Calculate the correlation coefficient, the
coefficient of determination, and the regression equation
predicting the respondent’s education with father’s education only.
Interpret your results. Determine the multiple correlation
coefficient, the multiple coefficient of determination, and the
regression equation predicting the respondent’s education with
father’s and mother’s education. Interpret your results. Did taking
into account the respondent’s mother’s education...
Investigate the relationship
between the respondent’s education (EDUC) and the education
received by his or her father and mother (PAEDUC and MAEDUC,
respectively). Calculate the correlation coefficient, the
coefficient of determination, and the regression equation
predicting the respondent’s education with father’s education only.
Interpret your results. Determine the multiple correlation
coefficient, the multiple coefficient of determination, and the
regression equation predicting the respondent’s education with
father’s and mother’s education. Interpret your results. Did taking
into account the respondent’s mother’s education...
 Model Summary Adjusted R Square Std. Error of the Estimate Model R R Square 1 .843a .711 .707 7.812812 a. Predictors: (Constant), Fuel efficiency, Horsepower Coefficientsa Standardized Coefficients Beta Sig 2.354 .020 Unstandardized Coefficients Model B Std. Error 1 (Constant) 28.144 11.954 Horsepower 229 .013 Length - 219 Fuel efficiency -.090 .185 a. Dependent Variable: Price in thousands .906 16.989 ,000 .050 - 205 -4.348 .000 -.027 -.488 .627 Model Summary Adjusted R Square Std. Error of the Estimate Model...
 The following questions refer to the output shown below.
Researchers used temperature to predict failure time for a
superconductive material with the following
a. Write the regression equation based on the results shown
below.
b. Assess the model utility.
linear model: yˆ = β0 + β1xtemp
Write the regression equation based on the results shown
below.
Would you recommend the model? Why or why not?
Model Summary Adjusted R Model R R Square Square .918a .843 .835 a. Predictors: (Constant),...
The following questions refer to the output shown below.
Researchers used temperature to predict failure time for a
superconductive material with the following
a. Write the regression equation based on the results shown
below.
b. Assess the model utility.
linear model: yˆ = β0 + β1xtemp
Write the regression equation based on the results shown
below.
Would you recommend the model? Why or why not?
Model Summary Adjusted R Model R R Square Square .918a .843 .835 a. Predictors: (Constant),...
 please help with step by step calculations
Variables Entered/Removed Variables Removed Model Variables Entered) Method contraception use (%) Enter a. All requested variables entered. b. Dependent Variable: fertility rate per woman Model Summary Std. Error of the Estimate Model R .71764 Adjusted R2 Square .469 220 168 a. Predictors: (Constant), contraception use %) ANOVA Model Sum of Squares Idf Regression 2.177 Residual 7.725 Total 9.902 Mean Square 2.177 .515 a. Predictors: (Constant), contraception use (%) b. Dependent Variable: fertility rate...
please help with step by step calculations
Variables Entered/Removed Variables Removed Model Variables Entered) Method contraception use (%) Enter a. All requested variables entered. b. Dependent Variable: fertility rate per woman Model Summary Std. Error of the Estimate Model R .71764 Adjusted R2 Square .469 220 168 a. Predictors: (Constant), contraception use %) ANOVA Model Sum of Squares Idf Regression 2.177 Residual 7.725 Total 9.902 Mean Square 2.177 .515 a. Predictors: (Constant), contraception use (%) b. Dependent Variable: fertility rate...
Most questions answered within 3 hours.
-
Where is the error in this code sequence?
String s1 = "Hello";
String s2 = "ello";...
asked 10 months ago -
Financial data for Joel de Paris, Inc., for last year
follow:
Joel de Paris, Inc.
Balance...
asked 10 months ago -
Consider this reaction:
Al2(SO4)3 (aq)+ BaCl3
(aq) Al2Cl6 (aq)- +
3BaSO4(s) . What is the...
asked 10 months ago -
Suppose that Savneet is considering increasing her
recent random sample from 20 car rentals to 40...
asked 10 months ago -
Trucks arrive at an unloading terminal at an average rate of 120
per hour.
Trucks arrive...
asked 10 months ago -
Why are methanol and ethanol completely soluble in water while
octanol is not very little soluble....
asked 10 months ago -
A facilities manager at a university reads in a research report
that the mean amount of...
asked 10 months ago -
When the CuSO4 is rehydrated by adding water to the anhydrous
compound, is this an endothermic...
asked 10 months ago -
A ray of sunlight is passing from diamond into crown glass; the
angle of incidence is...
asked 10 months ago -
A block of mass 0.249 kg is placed on top of a light, vertical
spring of...
asked 10 months ago -
how do the kidneys compensate in the presences of acidosis
a) trigger hyperventilate
b) reserve acid...
asked 10 months ago -
Question 501 pts
The rental rate of capital to the firm increases. Which of the
following...
asked 10 months ago