![4 (a) Based on the block diagram for a control system (Figure Q4(a) below) determine the transfer function between the error and the set point, E(s)/R(s) (8 marks) R(s)+ c(p) m(s) Figure Q4(a) Figure Q4(b) below shows two different control strategies for a continuous stirred tank reactor (CSTR). The reaction A → B is exothermic and the heat generated is removed by the coolant flowing through the jacket. It is assumed the flowrate of the reactor feed is fixed. Two anticipated disturbances to the system are coolant and feed inlet temperatures, Te and T (b) 4 marks] (i) Draw the block diagram for both control strategies. (i) Discuss briefly how the two control systems deal with To and compare their performance. [4 marks (ii) Discuss briefly how the two systems deal with the disturbance T, and compare their performance. [4 marks] Feed, F, T, Feed, F, T, Coolant Ts out Coolant m out TC SP TC TC A--Bİ|Product Product Te T. Coolant irn Coolant in Feedback Cascade Figure Q4(b)](http://img.homeworklib.com/questions/1e537df0-8db1-11eb-af80-f7728760f401.png?x-oss-process=image/resize,w_560)
Homework Answers

Add Answer to:
4 (a) Based on the block diagram for a control system (Figure Q4(a) below) determine the...
Master Discuss control strategies from Chapters 15 and 16 that may be useful for solving this...
 Master Discuss control strategies from Chapters 15 and 16 that may be useful for solving this problem. Explain why a given strat egy might be appropriate but also indicate possible pitfalls. Chapter 23 discusses a diabetes simulation Slave (TC Polymerizer Coolant 16.26 Figure E16.26 shows cascade temperature control of a polymerization reactor, which uses feed heat exchange to adjust the reactor temperature. Using the instrumentation diagram, explain how this cascade control system (both master and slave components) handles the following...
Q4. (a) Reduce the block diagram shown in Figure Q4a to a single mathematical expression suitable for implementation in MATLAB. Each letter represents a transfer function in the s-domain. (...
 Q4. (a) Reduce the block diagram shown in Figure Q4a to a single mathematical expression suitable for implementation in MATLAB. Each letter represents a transfer function in the s-domain. (10) G1 G2 G3 G4 G5 G6 Figure Q4a (b) Describe the process of generating the Nyquist plot. (c) Discuss how you would investigate the stability of a control system using the Nyquist plot and gain and phase margins of stability. (7) Q4 Total Marks [25] educe the block diagram shown...
Question 4 (a) A feedback control system with a proportional controller is shown in Figure Q4...
 Question 4 (a) A feedback control system with a proportional controller is shown in Figure Q4 (a). (i) Sketch the root locus of the system, (ii) Design the proportional controller (choose the value of K) such that the damping ratio does not exceed 0.5 and the time constant is less than 1 second. [All necessary steps of root locus construction and controller design must be shown). C(s) R(S) + s(s+4)(s + 10) Figure Q4 (a). A feedback control system [11...
Consider the block diagram as shown in Figure Q4(a) for the system under consideration. Assume the...
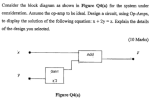 Consider the block diagram as shown in Figure Q4(a) for the system under consideration. Assume the op-amp to be ideal. Design a circuit, using Op-Amps, to display the solution of the following equation: x + 2y = z. Explain the details of the design you selected. (10 Marks) Add Gain x2 Figure Q4(a)
Task: 4 (35 Marks) The block diagram representation of a CNC machine speed control system is...
 Task: 4 (35 Marks) The block diagram representation of a CNC machine speed control system is shown in Figure 4 with the gain of K, and the feedback value of K2. R(s) + cls 100 1 + 0.2s G1=6.5 K1=14.5 K2=0.55 R=3 L=7 C=0.5 Figure 4 (i). Evaluate the closed loop transfer function of the CNC speed control system; (i). Estimate the value of time constant (T) and dc gain K for the CNC speed control system; Note: Each student...
Q.4 A position control system is shown in Figure Q4. Assume that K(s) = K, the plant 50 s(0.2s +1) transfer function is given by G(s) s02s y(t) r(t) Figure Q4: Feedback control system. (a) Design a l...
 Q.4 A position control system is shown in Figure Q4. Assume that K(s) = K, the plant 50 s(0.2s +1) transfer function is given by G(s) s02s y(t) r(t) Figure Q4: Feedback control system. (a) Design a lead compensator so that the closed-loop system satisfies the following specifications (i) The steady-state error to a unit-ramp input is less than 1/200 (ii) The unit-step response has an overshoot of less than 16% Ts +1 Hint: Compensator, Dc(s)=aTs+ 1, wm-T (18 marks)...
Question 4 A control system is shown in Figure 3, where Ge(s) is the controller, R(s)...
 Question 4 A control system is shown in Figure 3, where Ge(s) is the controller, R(s) is the setpoint temperature, Tw is the measured water temperature, Ta is the ambient temperature and u(t) is the rate of heat supplied to the heater. The mathematical model of a simple thermal system consisting of an insulated tank of water is given by: dTW = c(1, - Iw) +u dt where c is the heat insulation coefficient. Heater Water R(s) Ta Gc/s) u(1)...
Q4. (a) Reduce the block diagram shown in Figure Q4a to a single mathematical expression suitable...
 Q4. (a) Reduce the block diagram shown in Figure Q4a to a single mathematical expression suitable for implementation in MATLAB. Each letter represents a transfer function in the s-domain. 10) G1G2 G3 G4 G5 G6 Figure Q4a (b) Describe the process of generating the Nyquist plot. (c) Discuss how you would investigate the stability of a control system using the Nyquist plot and gain and phase margins of stability. 7)
Problem 1: Consider the block functional diagram of the satellite attitude control system shown in Figure...
 Problem 1: Consider the block functional diagram of the satellite attitude control system shown in Figure (a), here below. The output of this system exhibits continued oscillations and is not desirable. This system can be improved by using a tachometer feedback. Ki, as shown in Figure (b). Assuming that = 4, using block diagram algebra and theory of time performance specifications for second order systems, please, compute: (1) the value of the gain K such that closed loop transfer function...
In the block diagram of the feedback control system shown in figure below, Gp(s) is the...
 In the block diagram of the feedback control system shown in figure below, Gp(s) is the transfer function of a process, R(s) is reference input, and A(s) and H(s) represent controllers. N(S) R(s) Gp(s) Process A(s) H(s) = _100_ , and H(s)-1 / GAS). Let Gs)-A(S)5.and Find the steady state value of the response C(t), when N(t) = R(t) = unit-step function. Is this also the maximum value attained by the response? Justify your answers. (s2+2s+4)
 Master Discuss control strategies from Chapters 15 and 16 that may be useful for solving this problem. Explain why a given strat egy might be appropriate but also indicate possible pitfalls. Chapter 23 discusses a diabetes simulation Slave (TC Polymerizer Coolant 16.26 Figure E16.26 shows cascade temperature control of a polymerization reactor, which uses feed heat exchange to adjust the reactor temperature. Using the instrumentation diagram, explain how this cascade control system (both master and slave components) handles the following...
 Q4. (a) Reduce the block diagram shown in Figure Q4a to a single mathematical expression suitable for implementation in MATLAB. Each letter represents a transfer function in the s-domain. (10) G1 G2 G3 G4 G5 G6 Figure Q4a (b) Describe the process of generating the Nyquist plot. (c) Discuss how you would investigate the stability of a control system using the Nyquist plot and gain and phase margins of stability. (7) Q4 Total Marks [25] educe the block diagram shown...
 Question 4 (a) A feedback control system with a proportional controller is shown in Figure Q4 (a). (i) Sketch the root locus of the system, (ii) Design the proportional controller (choose the value of K) such that the damping ratio does not exceed 0.5 and the time constant is less than 1 second. [All necessary steps of root locus construction and controller design must be shown). C(s) R(S) + s(s+4)(s + 10) Figure Q4 (a). A feedback control system [11...
 Consider the block diagram as shown in Figure Q4(a) for the system under consideration. Assume the op-amp to be ideal. Design a circuit, using Op-Amps, to display the solution of the following equation: x + 2y = z. Explain the details of the design you selected. (10 Marks) Add Gain x2 Figure Q4(a)
 Task: 4 (35 Marks) The block diagram representation of a CNC machine speed control system is shown in Figure 4 with the gain of K, and the feedback value of K2. R(s) + cls 100 1 + 0.2s G1=6.5 K1=14.5 K2=0.55 R=3 L=7 C=0.5 Figure 4 (i). Evaluate the closed loop transfer function of the CNC speed control system; (i). Estimate the value of time constant (T) and dc gain K for the CNC speed control system; Note: Each student...
 Q.4 A position control system is shown in Figure Q4. Assume that K(s) = K, the plant 50 s(0.2s +1) transfer function is given by G(s) s02s y(t) r(t) Figure Q4: Feedback control system. (a) Design a lead compensator so that the closed-loop system satisfies the following specifications (i) The steady-state error to a unit-ramp input is less than 1/200 (ii) The unit-step response has an overshoot of less than 16% Ts +1 Hint: Compensator, Dc(s)=aTs+ 1, wm-T (18 marks)...
 Question 4 A control system is shown in Figure 3, where Ge(s) is the controller, R(s) is the setpoint temperature, Tw is the measured water temperature, Ta is the ambient temperature and u(t) is the rate of heat supplied to the heater. The mathematical model of a simple thermal system consisting of an insulated tank of water is given by: dTW = c(1, - Iw) +u dt where c is the heat insulation coefficient. Heater Water R(s) Ta Gc/s) u(1)...
 Q4. (a) Reduce the block diagram shown in Figure Q4a to a single mathematical expression suitable for implementation in MATLAB. Each letter represents a transfer function in the s-domain. 10) G1G2 G3 G4 G5 G6 Figure Q4a (b) Describe the process of generating the Nyquist plot. (c) Discuss how you would investigate the stability of a control system using the Nyquist plot and gain and phase margins of stability. 7)
 Problem 1: Consider the block functional diagram of the satellite attitude control system shown in Figure (a), here below. The output of this system exhibits continued oscillations and is not desirable. This system can be improved by using a tachometer feedback. Ki, as shown in Figure (b). Assuming that = 4, using block diagram algebra and theory of time performance specifications for second order systems, please, compute: (1) the value of the gain K such that closed loop transfer function...
 In the block diagram of the feedback control system shown in figure below, Gp(s) is the transfer function of a process, R(s) is reference input, and A(s) and H(s) represent controllers. N(S) R(s) Gp(s) Process A(s) H(s) = _100_ , and H(s)-1 / GAS). Let Gs)-A(S)5.and Find the steady state value of the response C(t), when N(t) = R(t) = unit-step function. Is this also the maximum value attained by the response? Justify your answers. (s2+2s+4)
Most questions answered within 3 hours.
-
Where is the error in this code sequence?
String s1 = "Hello";
String s2 = "ello";...
asked 11 months ago -
Financial data for Joel de Paris, Inc., for last year
follow:
Joel de Paris, Inc.
Balance...
asked 11 months ago -
Consider this reaction:
Al2(SO4)3 (aq)+ BaCl3
(aq) Al2Cl6 (aq)- +
3BaSO4(s) . What is the...
asked 11 months ago -
Suppose that Savneet is considering increasing her
recent random sample from 20 car rentals to 40...
asked 11 months ago -
Trucks arrive at an unloading terminal at an average rate of 120
per hour.
Trucks arrive...
asked 11 months ago -
Why are methanol and ethanol completely soluble in water while
octanol is not very little soluble....
asked 11 months ago -
A facilities manager at a university reads in a research report
that the mean amount of...
asked 11 months ago -
When the CuSO4 is rehydrated by adding water to the anhydrous
compound, is this an endothermic...
asked 11 months ago -
A ray of sunlight is passing from diamond into crown glass; the
angle of incidence is...
asked 11 months ago -
A block of mass 0.249 kg is placed on top of a light, vertical
spring of...
asked 11 months ago -
how do the kidneys compensate in the presences of acidosis
a) trigger hyperventilate
b) reserve acid...
asked 11 months ago -
Question 501 pts
The rental rate of capital to the firm increases. Which of the
following...
asked 11 months ago