

Homework Answers
EXPLANATION:
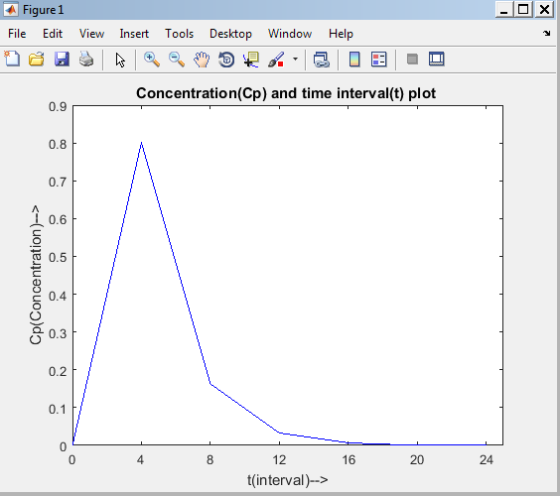
Here the concentration values(Cp) along with time interval for 0,4,8,12,16 are also displayed along with the plot of Cp vs t for 24 Hours.
continue statement is used to omit formulated(as per question) Cp values for interval (t) 20 and 24 or for the value of i 6 and 7.
here set(gca,'XTick',t); command is used to give x axis with intervals 0, 4, 8, 12, 16, 20 and 24
clc
clear all
close all
Dg=150;
Vd=50;
ke=0.4;
ka=1.6;
t=0:4:24;
i=1;
t1=0;
fprintf('Concentration of Drug in body:\n');
for i=1:length(t)
if(i>5)
% as at regular interval of 4hours, 4 more does are
administered
% after first dose given at t=0
% So, total 5 doses are given at t=0,4,8,12,16 time interval
% after that no does is given.So,concentration of drug is taken
for
%last 2 intervals of t=20 ,24 as 0.Because final plot will be
taken
%as t(0:4:24) vs cp.So for last 2 intervals plot requires value
for
%cp.
Cp(i)=0.0;
% as alrady all doses are given,so continue statement move the
flow
%control to for loop and increnent the value of i.
continue;
end
if(i<=5)
% insert dose concentration details in array for interval
% t=0,4,8,12,16
Cp(i)=(Dg/Vd)*(ka/(ka-ke))*(exp(-ke*t(i))-exp(-ka*t(i)));
% print t and Cp value
fprintf('t = %d : %f \n ',t(i),Cp(i));
end
end
% plot graph for t=24 hours and Cp with blue line plotting
t=0:4:24;
plot(t,Cp, 'blue')
%x axis labeling
xlabel('t(interval)-->')
%y axis labeling
ylabel('Cp(Concentration)-->')
% set x axis values from 0 to 24 at regular interval of 4
set(gca,'XTick',t);
%x graph title
title('Concentration(Cp) and time interval(t) plot ')
fprintf('\n');
SCREEN SHOT


OUTPUT

Add Answer to:
ANSWER PART B, I HAVE PART A.
MATLAB ONLY!! WRITE IN COMPUTER SO I CAN COPY...
MATLAB ONLY!! PLEASE WRITE IN COMPUTER SO I CAN COPY PASTE!!! ANSWER COMPLETELY, USE FOR LOOPS....
 MATLAB ONLY!! PLEASE WRITE IN COMPUTER SO I CAN COPY
PASTE!!! ANSWER COMPLETELY, USE FOR LOOPS.
THE PROGRAM TO BE MODIFIED IS THE NEXT ONE:
clc
clear
% Approximate the value of e ^ x using the Taylor Series
x = input( 'Enter the value of x for e^x. x = ' );
t = input( 'Enter the amount of desired terms. t = ' );
i = 1;
e_taylor = 0; % initializing the variable for the
accumulator
while...
MATLAB ONLY!! PLEASE WRITE IN COMPUTER SO I CAN COPY
PASTE!!! ANSWER COMPLETELY, USE FOR LOOPS.
THE PROGRAM TO BE MODIFIED IS THE NEXT ONE:
clc
clear
% Approximate the value of e ^ x using the Taylor Series
x = input( 'Enter the value of x for e^x. x = ' );
t = input( 'Enter the amount of desired terms. t = ' );
i = 1;
e_taylor = 0; % initializing the variable for the
accumulator
while...
MATLAB ONLY!!! PLEASE WRITE IN COMPUTER SO I CAN COPY PASTE!!! ANSWER COMPLETELY, IS ONLY ONE...
 MATLAB ONLY!!! PLEASE WRITE IN COMPUTER SO I CAN COPY
PASTE!!!
ANSWER COMPLETELY, IS ONLY ONE PROGRAM!!!
Body surface Area (Problem 6 Page 249). The body surface area (BSA) in m? of a person (used for determining dosage of medications) can be calculated by the formula (Du Bois formula): BSA = 0.007184 W0.425 H0.75 In which W is the mass in kg and H is the height in cm. Create a GUI to calculate the body surface area (BSA). The...
MATLAB ONLY!!! PLEASE WRITE IN COMPUTER SO I CAN COPY
PASTE!!!
ANSWER COMPLETELY, IS ONLY ONE PROGRAM!!!
Body surface Area (Problem 6 Page 249). The body surface area (BSA) in m? of a person (used for determining dosage of medications) can be calculated by the formula (Du Bois formula): BSA = 0.007184 W0.425 H0.75 In which W is the mass in kg and H is the height in cm. Create a GUI to calculate the body surface area (BSA). The...
I have all of the answers to this can someone just actually explain this matlab code and the results to me so i can get a better understanding? b) (c) and (d) %% Matlab code %% clc; close all; clear...
 I have all of the answers to this can someone just actually
explain this matlab code and the results to me so i can get a
better understanding?
b)
(c) and (d)
%% Matlab code %%
clc;
close all;
clear all;
format long;
f=@(t,y)y*(1-y);
y(1)=0.01;
%%%% Exact solution
[t1 y1]=ode45(f,[0 9],y(1));
figure;
plot(t1,y1,'*');
hold on
% Eular therom
M=[32 64 128];
T=9;
fprintf(' M Max error \n' );
for n=1:length(M)
k=T/M(n);
t=0:k:T;
for h=1:length(t)-1
y(h+1)=y(h)+k*f(t(h),y(h));
end
plot(t,y);
hold on
%%%...
I have all of the answers to this can someone just actually
explain this matlab code and the results to me so i can get a
better understanding?
b)
(c) and (d)
%% Matlab code %%
clc;
close all;
clear all;
format long;
f=@(t,y)y*(1-y);
y(1)=0.01;
%%%% Exact solution
[t1 y1]=ode45(f,[0 9],y(1));
figure;
plot(t1,y1,'*');
hold on
% Eular therom
M=[32 64 128];
T=9;
fprintf(' M Max error \n' );
for n=1:length(M)
k=T/M(n);
t=0:k:T;
for h=1:length(t)-1
y(h+1)=y(h)+k*f(t(h),y(h));
end
plot(t,y);
hold on
%%%...
7. Smokers are known to have about 50% higher CL than nonsmokers for theophylline. If the...
 7. Smokers are known to have about 50% higher CL than nonsmokers for theophylline. If the average observed AUC after administration of 300 mg IV theophylline in nonsmokers is 100 mg.hr/L, what is the expected AUC in smokers after administration of the same 300 mg dose? Theophylline undergoes linear pharmacokinetics 2. After administration of a single 400 mg dose of a drug, a linear plot of the serum concentration-time prorile on a semi-log graph paper showed a y-intercept of 1mg/mL...
 MATLAB ONLY!! PLEASE WRITE IN COMPUTER SO I CAN COPY
PASTE!!! ANSWER COMPLETELY, USE FOR LOOPS.
THE PROGRAM TO BE MODIFIED IS THE NEXT ONE:
clc
clear
% Approximate the value of e ^ x using the Taylor Series
x = input( 'Enter the value of x for e^x. x = ' );
t = input( 'Enter the amount of desired terms. t = ' );
i = 1;
e_taylor = 0; % initializing the variable for the
accumulator
while...
MATLAB ONLY!! PLEASE WRITE IN COMPUTER SO I CAN COPY
PASTE!!! ANSWER COMPLETELY, USE FOR LOOPS.
THE PROGRAM TO BE MODIFIED IS THE NEXT ONE:
clc
clear
% Approximate the value of e ^ x using the Taylor Series
x = input( 'Enter the value of x for e^x. x = ' );
t = input( 'Enter the amount of desired terms. t = ' );
i = 1;
e_taylor = 0; % initializing the variable for the
accumulator
while...
 MATLAB ONLY!!! PLEASE WRITE IN COMPUTER SO I CAN COPY
PASTE!!!
ANSWER COMPLETELY, IS ONLY ONE PROGRAM!!!
Body surface Area (Problem 6 Page 249). The body surface area (BSA) in m? of a person (used for determining dosage of medications) can be calculated by the formula (Du Bois formula): BSA = 0.007184 W0.425 H0.75 In which W is the mass in kg and H is the height in cm. Create a GUI to calculate the body surface area (BSA). The...
MATLAB ONLY!!! PLEASE WRITE IN COMPUTER SO I CAN COPY
PASTE!!!
ANSWER COMPLETELY, IS ONLY ONE PROGRAM!!!
Body surface Area (Problem 6 Page 249). The body surface area (BSA) in m? of a person (used for determining dosage of medications) can be calculated by the formula (Du Bois formula): BSA = 0.007184 W0.425 H0.75 In which W is the mass in kg and H is the height in cm. Create a GUI to calculate the body surface area (BSA). The...
 I have all of the answers to this can someone just actually
explain this matlab code and the results to me so i can get a
better understanding?
b)
(c) and (d)
%% Matlab code %%
clc;
close all;
clear all;
format long;
f=@(t,y)y*(1-y);
y(1)=0.01;
%%%% Exact solution
[t1 y1]=ode45(f,[0 9],y(1));
figure;
plot(t1,y1,'*');
hold on
% Eular therom
M=[32 64 128];
T=9;
fprintf(' M Max error \n' );
for n=1:length(M)
k=T/M(n);
t=0:k:T;
for h=1:length(t)-1
y(h+1)=y(h)+k*f(t(h),y(h));
end
plot(t,y);
hold on
%%%...
I have all of the answers to this can someone just actually
explain this matlab code and the results to me so i can get a
better understanding?
b)
(c) and (d)
%% Matlab code %%
clc;
close all;
clear all;
format long;
f=@(t,y)y*(1-y);
y(1)=0.01;
%%%% Exact solution
[t1 y1]=ode45(f,[0 9],y(1));
figure;
plot(t1,y1,'*');
hold on
% Eular therom
M=[32 64 128];
T=9;
fprintf(' M Max error \n' );
for n=1:length(M)
k=T/M(n);
t=0:k:T;
for h=1:length(t)-1
y(h+1)=y(h)+k*f(t(h),y(h));
end
plot(t,y);
hold on
%%%...
 7. Smokers are known to have about 50% higher CL than nonsmokers for theophylline. If the average observed AUC after administration of 300 mg IV theophylline in nonsmokers is 100 mg.hr/L, what is the expected AUC in smokers after administration of the same 300 mg dose? Theophylline undergoes linear pharmacokinetics 2. After administration of a single 400 mg dose of a drug, a linear plot of the serum concentration-time prorile on a semi-log graph paper showed a y-intercept of 1mg/mL...
Most questions answered within 3 hours.
-
Where is the error in this code sequence?
String s1 = "Hello";
String s2 = "ello";...
asked 10 months ago -
Financial data for Joel de Paris, Inc., for last year
follow:
Joel de Paris, Inc.
Balance...
asked 10 months ago -
Consider this reaction:
Al2(SO4)3 (aq)+ BaCl3
(aq) Al2Cl6 (aq)- +
3BaSO4(s) . What is the...
asked 10 months ago -
Suppose that Savneet is considering increasing her
recent random sample from 20 car rentals to 40...
asked 10 months ago -
Trucks arrive at an unloading terminal at an average rate of 120
per hour.
Trucks arrive...
asked 10 months ago -
Why are methanol and ethanol completely soluble in water while
octanol is not very little soluble....
asked 10 months ago -
A facilities manager at a university reads in a research report
that the mean amount of...
asked 10 months ago -
When the CuSO4 is rehydrated by adding water to the anhydrous
compound, is this an endothermic...
asked 10 months ago -
A ray of sunlight is passing from diamond into crown glass; the
angle of incidence is...
asked 10 months ago -
A block of mass 0.249 kg is placed on top of a light, vertical
spring of...
asked 10 months ago -
how do the kidneys compensate in the presences of acidosis
a) trigger hyperventilate
b) reserve acid...
asked 10 months ago -
Question 501 pts
The rental rate of capital to the firm increases. Which of the
following...
asked 10 months ago