
Homework Answers

Add Answer to:
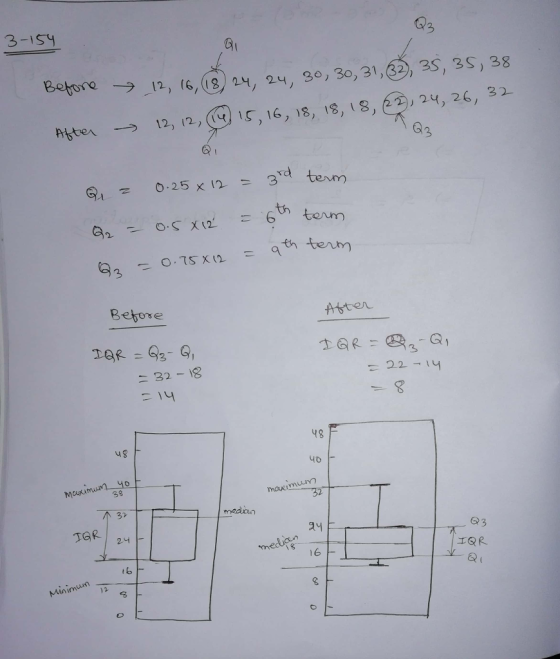
x 3-154. The data shown here represent the number of hours 12 part-time employees at a...
Use a stem-and-leaf plot to display the data, which represent the numbers of hours 24 nurses...
Use a stem-and-leaf plot to display the data, which represent the numbers of hours 24 nurses work per week. Describe any patterns. 40 40 40 48 38 40 36 52 32 36 40 35 30 26 40 36 40 36 40 33 40 32 38 49 Determine the leaves in the stem-and-leaf plot below. Key: 3|3equals=33 Hours worked 22 nothing 33 nothing 44 nothing 55 nothing
The data to the right represent the number of chocolate chips per cookie in a random...
 The data to the right represent the number of chocolate chips per cookie in a random sample of a name brand and a store brand. Complete parts (a) to (c) below. Full data set Name Brand Store Brand 22 26 28 28 24 28 25 29 23 19 23 27 23 35 22 33 15 24 24 31 28 26 17 21 32 (a) Draw side-by-side boxplots for each brand of cookie Label the boxplots "N" for the name brand...
1 The following data represents the number of innings pitched by the ERA leaders for the...
 1 The following data represents the number of innings pitched by the ERA leaders for the past few years 23, 30, 20, 27, 44, 26, 35, 20, 29. 29, 25, 15, 18, 27, 19, 22, 12, 26. 34. 15. 27, 35, 26, ald43 35, 14, 24, 12, 23. 31, 40. 35, 38, 57, 22. 42, 24, 21, 27, 33 1. Find the value that corresponds to the 70th percentile. 2. Identify all the outiiers 3. Construct a boxplot for the...
For each of the following chemical structures a 'H-NMR spectrum is provided on the following 3...
 For each of the following chemical structures a 'H-NMR spectrum is provided on the following 3 pages. Match each compound with its 'H-NMR spectrum. Draw the structure above the corresponding spectrum and clearly assign the chemical shifts to the appropriate protons on the molecule. CH, CH, CH 3-methylbutanal 1-pentene p-ethylanisole "ОН Br diethyl malonate 2-bromobutane butanoic acid .Br OH 1-bromopropane 1-propanol diethyl ethylmalonate 30 1 1e 20 20 10 12 10 08 16 14 22 20 18 34 32 30...
An industrial designer wants to determine the average amount of time it takes an adult to...
 An industrial designer wants to determine the average amount of
time it takes an adult to assemble an “easy to assemble” toy
10 points Save Answer QUESTION 4 An industrial designer wants to determine the average amount of time it takes an adult to assemble an "easy-to-assemble” toy. Use the following data (in minutes), a random sample, to construct a 95% confidence interval for the mean of the population sampled: 17 26 16 13 23 10 18 24 20 19...
An industrial designer wants to determine the average amount of
time it takes an adult to assemble an “easy to assemble” toy
10 points Save Answer QUESTION 4 An industrial designer wants to determine the average amount of time it takes an adult to assemble an "easy-to-assemble” toy. Use the following data (in minutes), a random sample, to construct a 95% confidence interval for the mean of the population sampled: 17 26 16 13 23 10 18 24 20 19...
1. The data set on sheet #1 gives data on GPA category and number of hours studied. Construct com...
1. The data set on sheet #1 gives data on GPA category and number of hours studied. Construct comparative box plots of the data first GPA category. Then conduct two-sample t-test on the data for whether GPA category influences the number of hours studied. Be prepared to explain the results of the test and the meaning of the boxplots and how they relate to each other. Then redo the analysis by replacing the ordinal GPA category with a numerical dummy...
Employee Years Employed Salary 1 27 $65,487 2 20 $46,184 3 0 $32,782 4 12 $54,899...
Employee Years Employed Salary 1 27 $65,487 2 20 $46,184 3 0 $32,782 4 12 $54,899 5 7 $34,869 6 8 $35,487 7 5 $26,548 8 15 $32,920 9 5 $29,548 10 6 $34,231 11 0 $23,654 12 9 $39,331 13 6 $36,512 14 3 $35,467 15 25 $68,425 16 9 $35,468 17 4 $36,578 18 18 $39,828 19 6 $36,487 20 19 $37,548 21 3 $31,528 22 5 $34,632 23 14 $46,211 24 2 $29,876 25 6 $43,674 26...
can someone take a look to these 3 pictures and fill in the blanks. I need...
 can someone take a look to these 3 pictures and fill
in the blanks. I need to show work and understand the answers.
thank you!
Birth to 36 months: Girls Head circumference-for-age and Welght-for-length percentiles NAME RECORD # Birth 3 69 12 15 18 21 24 27 30 33 36 AGE (MONTHS cm in ina cm 52 19--48 46 46-18 42 50 22 48 15--38 2044 19--42 18-40 38 36 34 -32 13 16 13 28 E 11 24 H...
can someone take a look to these 3 pictures and fill
in the blanks. I need to show work and understand the answers.
thank you!
Birth to 36 months: Girls Head circumference-for-age and Welght-for-length percentiles NAME RECORD # Birth 3 69 12 15 18 21 24 27 30 33 36 AGE (MONTHS cm in ina cm 52 19--48 46 46-18 42 50 22 48 15--38 2044 19--42 18-40 38 36 34 -32 13 16 13 28 E 11 24 H...
A commercial bakery has recorded sales (in dozens) for three products, as shown below: Day Blueberry...
A commercial bakery has recorded sales (in dozens) for three products, as shown below: Day Blueberry Muffins Cinnamon Buns Cupcakes 1 30 17 46 2 33 16 12 3 32 18 16 4 32 18 49 5 35 21 22 6 32 22 17 7 31 24 14 8 38 22 51 9 29 25 18 10 33 26 18 11 38 26 11 12 32 27 54 13 39 29 17 14 32 33 14 15 37 35 12...
48 57 Amy Bakery has four shops in different area in a city. Monthly sales (in...
 48 57 Amy Bakery has four shops in different area in a city. Monthly sales (in thousands of dollars) from a random of 24 months from each of the 4 shops given in Table 1. Table 1: Monthly sales (in thousands of dollars) North East South West 77 75 97 60 45 42 60 54 56 49 68 47 44 39 58 57 63 61 69 51 75 63 79 50 90 81 99 73 32 47 46 41 41...
 The data to the right represent the number of chocolate chips per cookie in a random sample of a name brand and a store brand. Complete parts (a) to (c) below. Full data set Name Brand Store Brand 22 26 28 28 24 28 25 29 23 19 23 27 23 35 22 33 15 24 24 31 28 26 17 21 32 (a) Draw side-by-side boxplots for each brand of cookie Label the boxplots "N" for the name brand...
 1 The following data represents the number of innings pitched by the ERA leaders for the past few years 23, 30, 20, 27, 44, 26, 35, 20, 29. 29, 25, 15, 18, 27, 19, 22, 12, 26. 34. 15. 27, 35, 26, ald43 35, 14, 24, 12, 23. 31, 40. 35, 38, 57, 22. 42, 24, 21, 27, 33 1. Find the value that corresponds to the 70th percentile. 2. Identify all the outiiers 3. Construct a boxplot for the...
 For each of the following chemical structures a 'H-NMR spectrum is provided on the following 3 pages. Match each compound with its 'H-NMR spectrum. Draw the structure above the corresponding spectrum and clearly assign the chemical shifts to the appropriate protons on the molecule. CH, CH, CH 3-methylbutanal 1-pentene p-ethylanisole "ОН Br diethyl malonate 2-bromobutane butanoic acid .Br OH 1-bromopropane 1-propanol diethyl ethylmalonate 30 1 1e 20 20 10 12 10 08 16 14 22 20 18 34 32 30...
 An industrial designer wants to determine the average amount of
time it takes an adult to assemble an “easy to assemble” toy
10 points Save Answer QUESTION 4 An industrial designer wants to determine the average amount of time it takes an adult to assemble an "easy-to-assemble” toy. Use the following data (in minutes), a random sample, to construct a 95% confidence interval for the mean of the population sampled: 17 26 16 13 23 10 18 24 20 19...
An industrial designer wants to determine the average amount of
time it takes an adult to assemble an “easy to assemble” toy
10 points Save Answer QUESTION 4 An industrial designer wants to determine the average amount of time it takes an adult to assemble an "easy-to-assemble” toy. Use the following data (in minutes), a random sample, to construct a 95% confidence interval for the mean of the population sampled: 17 26 16 13 23 10 18 24 20 19...
 can someone take a look to these 3 pictures and fill
in the blanks. I need to show work and understand the answers.
thank you!
Birth to 36 months: Girls Head circumference-for-age and Welght-for-length percentiles NAME RECORD # Birth 3 69 12 15 18 21 24 27 30 33 36 AGE (MONTHS cm in ina cm 52 19--48 46 46-18 42 50 22 48 15--38 2044 19--42 18-40 38 36 34 -32 13 16 13 28 E 11 24 H...
can someone take a look to these 3 pictures and fill
in the blanks. I need to show work and understand the answers.
thank you!
Birth to 36 months: Girls Head circumference-for-age and Welght-for-length percentiles NAME RECORD # Birth 3 69 12 15 18 21 24 27 30 33 36 AGE (MONTHS cm in ina cm 52 19--48 46 46-18 42 50 22 48 15--38 2044 19--42 18-40 38 36 34 -32 13 16 13 28 E 11 24 H...
 48 57 Amy Bakery has four shops in different area in a city. Monthly sales (in thousands of dollars) from a random of 24 months from each of the 4 shops given in Table 1. Table 1: Monthly sales (in thousands of dollars) North East South West 77 75 97 60 45 42 60 54 56 49 68 47 44 39 58 57 63 61 69 51 75 63 79 50 90 81 99 73 32 47 46 41 41...
Most questions answered within 3 hours.
-
Where is the error in this code sequence?
String s1 = "Hello";
String s2 = "ello";...
asked 10 months ago -
Financial data for Joel de Paris, Inc., for last year
follow:
Joel de Paris, Inc.
Balance...
asked 10 months ago -
Consider this reaction:
Al2(SO4)3 (aq)+ BaCl3
(aq) Al2Cl6 (aq)- +
3BaSO4(s) . What is the...
asked 10 months ago -
Suppose that Savneet is considering increasing her
recent random sample from 20 car rentals to 40...
asked 10 months ago -
Trucks arrive at an unloading terminal at an average rate of 120
per hour.
Trucks arrive...
asked 10 months ago -
Why are methanol and ethanol completely soluble in water while
octanol is not very little soluble....
asked 10 months ago -
A facilities manager at a university reads in a research report
that the mean amount of...
asked 10 months ago -
When the CuSO4 is rehydrated by adding water to the anhydrous
compound, is this an endothermic...
asked 10 months ago -
A ray of sunlight is passing from diamond into crown glass; the
angle of incidence is...
asked 10 months ago -
A block of mass 0.249 kg is placed on top of a light, vertical
spring of...
asked 10 months ago -
how do the kidneys compensate in the presences of acidosis
a) trigger hyperventilate
b) reserve acid...
asked 10 months ago -
Question 501 pts
The rental rate of capital to the firm increases. Which of the
following...
asked 10 months ago