
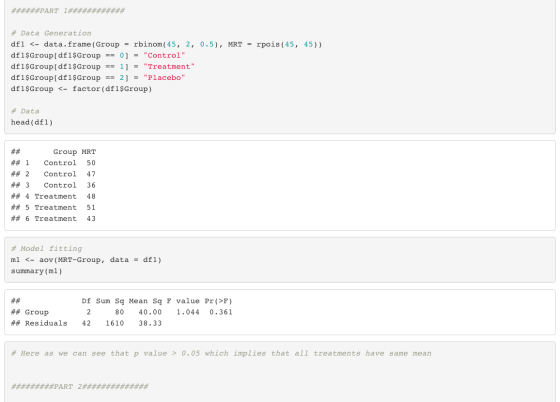
Homework Answers
Both the parts are done in R
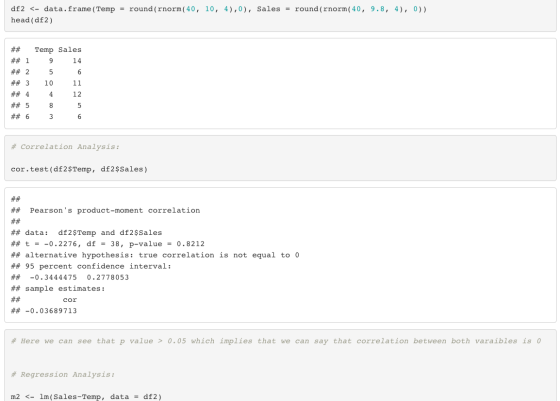
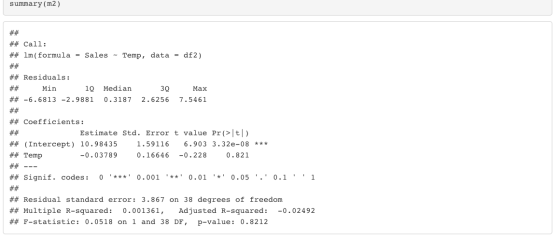
Code along with output is attached herewith.
DO hit the like button if you like the solution.
Add Answer to:
for
this workbook u can make up your own data. it doesnt matter
Workbook 2.9. Use...
Part II: SPSS Application These questions require the use of SPSS. Remember you must submit all of your work within this word document. You will need to take a screen shot of your data view if ne...
Part II: SPSS Application These questions require the use of SPSS. Remember you must submit all of your work within this word document. You will need to take a screen shot of your data view if necessary, or copy and paste your output into the spaces below. Remember to report the exact p value provided by SPSS output – simply reporting p<.05 or p>.05 is not acceptable (unless SPSS output states p=.000 – in that case you can report p<.001)....
General Requirements: Use the following information to ensure successful completion of the assignment: Review "SPSS Access...
General Requirements: Use the following information to ensure successful completion of the assignment: Review "SPSS Access Instructions" for information on how to access SPSS for this assignment. Download "Module 8 Problem Set" and use it for this assignment. Directions: Perform the following tasks to complete this assignment: Conduct necessary analyses using SPSS so you can answer the questions listed in the exercise. Submit your responses to the exercise questions as a Word document. Submit the SPSS Output files showing the...
Erika Diaz Your name Assignment 10 Correlation, Scatterplot, and Prediction (due 7/30/20 - 1/4/20)(28 pts) 1....
 Erika Diaz Your name Assignment 10 Correlation, Scatterplot, and Prediction (due 7/30/20 - 1/4/20)(28 pts) 1. A teacher hypothesizes that the more days of school student misses, the worse the student will do on a final exam (possible scores on the exam range from 0 to 20). She obtained a random sample of 12 students. The data are shown below. Student days missed Final exam score 1 3 16 2 2 17 3 5 13 4 8 7 5 4...
Oliò Description and Requirements Computer Lab Assignment #9 1. Use Excel and the "Restaurant" da...
 oliò Description and Requirements Computer Lab Assignment #9 1. Use Excel and the "Restaurant" data set file located in D2L for this assignment 2. For each class (Class 1 to 14), consider the number of customers for day 7. Call this new variable, day data, as X1. Consider the number of waiters/waitresses as variable X2.Consider the customer satisfaction as vanable Y In another word, create a table for variables Y, X.X2 Dependent Variable: Y Independent Variables: X,X2 3. Find a...
Part II: SPSS Application These questions require the use of SPSS. Remember you must submit all...
Part II: SPSS Application These questions require the use of SPSS. Remember you must submit all of your work within this word document. You will need to take a screen shot of your data view if necessary, or copy and paste your output into the spaces below. Remember to report the exact p value provided by SPSS output – simply reporting p<.05 or p>.05 is not acceptable (unless SPSS output states p=.000 – in that case you can report p<.001)....
SPSS: Correlation Use SPSS or Excel to calculate the appropriate correlation coefficient for the following data...
SPSS: Correlation Use SPSS or Excel to calculate the appropriate correlation coefficient for the following data for “Hours of Exercise” and “Life Satisfaction.” (0 = Not at all satisfied). Provide an APA-style results section write – up. (b) Graph the relationship. HINT: Below you will find instructions for the APA-style write-up. Complete the write-up on a word document and upload the file for submission. Hours of Exercise Life Satisfaction 2 6 0 2 5 13 6 15 1 3 2...
Problem: You are interested in factors that predict the salaries of catwalk models. You collected...
 Problem: You are interested in factors that predict the salaries
of catwalk models. You collected data from 231 models (attached
SPSS data file: supermodel_1.sav). For each model, you asked:
salary per day in dollars (on days when working (variable:
salary_2), age (variable: age), and how many years they have worked
as a model (variable: years). You also got a panel of experts from
various modeling agencies to rate the attractiveness of each model
as a percentage, with 100% being perfectly...
Problem: You are interested in factors that predict the salaries
of catwalk models. You collected data from 231 models (attached
SPSS data file: supermodel_1.sav). For each model, you asked:
salary per day in dollars (on days when working (variable:
salary_2), age (variable: age), and how many years they have worked
as a model (variable: years). You also got a panel of experts from
various modeling agencies to rate the attractiveness of each model
as a percentage, with 100% being perfectly...
Assume for a moment that these 20 houses made up the entire population of houses in San Antonio. Use the Data Analysis...
 Assume for a moment that these 20 houses made up the entire population of houses in San Antonio. Use the Data Analysis Sampling function to choose a random sample of 7 house prices from the population. Put a label called "Sample of 7" over the list you create. 4. 3. Highlight all the data, including both Square Footage and Price, and use the Insert Scatter function to create a Scatter Diagram. Change the title and add a linear trend line...
Comparing two means: When drink drove a student to statistics (Rubric included) Instructions For this assignment,...
Comparing two means: When drink drove a student to statistics (Rubric included) Instructions For this assignment, you review this week’s Learning Resources and then perform a two-sample independent t test and an ANOVA related to the dataset that was utilized in the week 2 SPSS application assignment. Import the data into SPSS; or, if you correctly saved the data file in Week 2, you may open and use that saved file to complete this assignment. Type your answers to all...
*JUST NEED 3 and 4 ANSWERED THANKS* 1. Explore the data: create a scatterplot . 1a....
 *JUST NEED 3 and 4 ANSWERED THANKS*
1. Explore the data: create a scatterplot
. 1a. Type the data into a blank SPSS spreadsheet. Name
variables as Distance and Snowfall respectively. Go to
Graphs-Legacy Dialogs-Scatter/Dot-Simple Scatter-Define. In the
window that follows, select Distance into X axis and Snowfall into
Y axis. Click on OK.
1b.Double click on the scatter plot to activate it. Double click
on the horizontal axis and select the Scale tab. At Auto, uncheck
all boxes. At...
*JUST NEED 3 and 4 ANSWERED THANKS*
1. Explore the data: create a scatterplot
. 1a. Type the data into a blank SPSS spreadsheet. Name
variables as Distance and Snowfall respectively. Go to
Graphs-Legacy Dialogs-Scatter/Dot-Simple Scatter-Define. In the
window that follows, select Distance into X axis and Snowfall into
Y axis. Click on OK.
1b.Double click on the scatter plot to activate it. Double click
on the horizontal axis and select the Scale tab. At Auto, uncheck
all boxes. At...
 Erika Diaz Your name Assignment 10 Correlation, Scatterplot, and Prediction (due 7/30/20 - 1/4/20)(28 pts) 1. A teacher hypothesizes that the more days of school student misses, the worse the student will do on a final exam (possible scores on the exam range from 0 to 20). She obtained a random sample of 12 students. The data are shown below. Student days missed Final exam score 1 3 16 2 2 17 3 5 13 4 8 7 5 4...
 oliò Description and Requirements Computer Lab Assignment #9 1. Use Excel and the "Restaurant" data set file located in D2L for this assignment 2. For each class (Class 1 to 14), consider the number of customers for day 7. Call this new variable, day data, as X1. Consider the number of waiters/waitresses as variable X2.Consider the customer satisfaction as vanable Y In another word, create a table for variables Y, X.X2 Dependent Variable: Y Independent Variables: X,X2 3. Find a...
 Problem: You are interested in factors that predict the salaries
of catwalk models. You collected data from 231 models (attached
SPSS data file: supermodel_1.sav). For each model, you asked:
salary per day in dollars (on days when working (variable:
salary_2), age (variable: age), and how many years they have worked
as a model (variable: years). You also got a panel of experts from
various modeling agencies to rate the attractiveness of each model
as a percentage, with 100% being perfectly...
Problem: You are interested in factors that predict the salaries
of catwalk models. You collected data from 231 models (attached
SPSS data file: supermodel_1.sav). For each model, you asked:
salary per day in dollars (on days when working (variable:
salary_2), age (variable: age), and how many years they have worked
as a model (variable: years). You also got a panel of experts from
various modeling agencies to rate the attractiveness of each model
as a percentage, with 100% being perfectly...
 Assume for a moment that these 20 houses made up the entire population of houses in San Antonio. Use the Data Analysis Sampling function to choose a random sample of 7 house prices from the population. Put a label called "Sample of 7" over the list you create. 4. 3. Highlight all the data, including both Square Footage and Price, and use the Insert Scatter function to create a Scatter Diagram. Change the title and add a linear trend line...
 *JUST NEED 3 and 4 ANSWERED THANKS*
1. Explore the data: create a scatterplot
. 1a. Type the data into a blank SPSS spreadsheet. Name
variables as Distance and Snowfall respectively. Go to
Graphs-Legacy Dialogs-Scatter/Dot-Simple Scatter-Define. In the
window that follows, select Distance into X axis and Snowfall into
Y axis. Click on OK.
1b.Double click on the scatter plot to activate it. Double click
on the horizontal axis and select the Scale tab. At Auto, uncheck
all boxes. At...
*JUST NEED 3 and 4 ANSWERED THANKS*
1. Explore the data: create a scatterplot
. 1a. Type the data into a blank SPSS spreadsheet. Name
variables as Distance and Snowfall respectively. Go to
Graphs-Legacy Dialogs-Scatter/Dot-Simple Scatter-Define. In the
window that follows, select Distance into X axis and Snowfall into
Y axis. Click on OK.
1b.Double click on the scatter plot to activate it. Double click
on the horizontal axis and select the Scale tab. At Auto, uncheck
all boxes. At...
Most questions answered within 3 hours.
-
Where is the error in this code sequence?
String s1 = "Hello";
String s2 = "ello";...
asked 10 months ago -
Financial data for Joel de Paris, Inc., for last year
follow:
Joel de Paris, Inc.
Balance...
asked 10 months ago -
Consider this reaction:
Al2(SO4)3 (aq)+ BaCl3
(aq) Al2Cl6 (aq)- +
3BaSO4(s) . What is the...
asked 10 months ago -
Suppose that Savneet is considering increasing her
recent random sample from 20 car rentals to 40...
asked 10 months ago -
Trucks arrive at an unloading terminal at an average rate of 120
per hour.
Trucks arrive...
asked 10 months ago -
Why are methanol and ethanol completely soluble in water while
octanol is not very little soluble....
asked 10 months ago -
A facilities manager at a university reads in a research report
that the mean amount of...
asked 10 months ago -
When the CuSO4 is rehydrated by adding water to the anhydrous
compound, is this an endothermic...
asked 10 months ago -
A ray of sunlight is passing from diamond into crown glass; the
angle of incidence is...
asked 10 months ago -
A block of mass 0.249 kg is placed on top of a light, vertical
spring of...
asked 10 months ago -
how do the kidneys compensate in the presences of acidosis
a) trigger hyperventilate
b) reserve acid...
asked 10 months ago -
Question 501 pts
The rental rate of capital to the firm increases. Which of the
following...
asked 10 months ago