A team of researchers is investigating a drug for reducing systolic blood pressure. Two groups each...
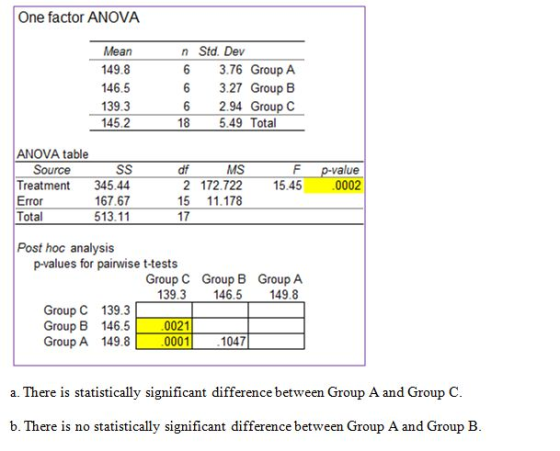
A team of researchers is investigating a drug for reducing systolic blood pressure. Two groups each has 6 subjects were selected in this study. Group A is the control group. The treatment was used for group B. A fixed increased amount of doses were used on group C. The systolic blood pressures were measured for all groups and are listed below. This team wishes to test whether there is a statistically significant difference in average systolic blood pressures between the three groups. If the assumption of normality and equal variances is accepted, which of the following conclusions is(are) correct from the multiple comparisons t-test using Bonferroni correction at 5% level of significance?
Group A - 144, 152, 155, 149, 151, 148
Group B - 143, 152, 148, 145, 144, 147
Group C - 140, 144, 140, 138, 135, 139
| a. |
There is statistically significant difference between Group A and Group C. |
|
| b. |
There is no statistically significant difference between Group A and Group B. |
|
| c. |
There is no statistically significant difference between Group A and Group C. |
|
| d. |
There is no statistically significant difference between Group B and Group C. |
|
| e. |
There is statistically significant difference between Group A and Group B. |
Homework Answers

Add Answer to:
A team of researchers is investigating a drug for reducing
systolic blood pressure. Two groups each...
A research team wishes to test whether there is a statistically significant difference in systolic blood...
A research team wishes to test whether there is a statistically significant difference in systolic blood pressures between two populations. The systolic blood pressures were measured for two samples taken independently from the two populations, and are listed below. If the Wilcoxon Rank Sum test is used for this problem, which of the followings is(are) correct? Group A 144 152 155 149 151 148 Group B 143 152 148 145 144 147 a. The asymptotic test p-value is .063 b....
The following are the Systolic blood pressure (mm Hg) of 12 patients undergoing drug therapy for...
The following are the Systolic blood pressure (mm Hg) of 12 patients undergoing drug therapy for hypertension: 183, 152, 178, 157, 194, 163, 144, 114, 178, 152, 118, 158. Please use the sign test to test if there is evidence that the median of the blood pressures of the population from which we assume this sample to have been drawn is different from 135 mmHg (the norm for the group). level of significance .05
When subjects were treated with a drug, their systolic blood pressure readings (in mm Hg) were...
When subjects were treated with a drug, their systolic blood pressure readings (in mm Hg) were measured before and after the drug was taken. Results are given in the table below. Assume that the paired sample data is a simple random sample and that the differences have a distribution that is approximately normal. Using a 0.05 significance level, is there sufficient evidence to support the claim that the drug is effective in lowering systolic blood pressure? Before: 188, 210, 157,...
please help desperately need it 7) When subjects were treated with a drug, their systolic blood...
 please help desperately need it
7) When subjects were treated with a drug, their systolic blood pressure readings (in mm Hg) were measured before and after the drug was taken. Results are given in the table below. Assume that the paired sample data is a simple random sample and that the differences have a distribution that is approximately normal. Using a 0.05 significance level, is there sufficient evidence to support the claim that the drug is effective in lowering systolic...
please help desperately need it
7) When subjects were treated with a drug, their systolic blood pressure readings (in mm Hg) were measured before and after the drug was taken. Results are given in the table below. Assume that the paired sample data is a simple random sample and that the differences have a distribution that is approximately normal. Using a 0.05 significance level, is there sufficient evidence to support the claim that the drug is effective in lowering systolic...
Suppose you are testing whether there is a statistically significant difference in systolic blood pressure (mmHg)...
Suppose you are testing whether there is a statistically significant difference in systolic blood pressure (mmHg) between a treatment and placebo group; that is, positive values indicate the treatment is more effective than the placebo, and negative values indicate the placebo is more effective than the treatment. The 95% CI is [8, 17] . Based on this interval, did the treatment group outperform the placebo, or vise versa? Should you reject or fail to reject the null hypothesis of no...
Listed below are systolic blood pressure measurements (mm Hg) taken from the right and left arms...
Listed below are systolic blood pressure measurements (mm Hg) taken from the right and left arms of the same woman. Assume that the paired sample data is a simple random sample and that the differences have a distribution that is approximately normal. Use a significance level to test for a difference between the measurements from the two arms. What can be concluded? right arm: 148, 139, 121, 129, 129 left arm: 182, 173, 189, 150, 147 In this example, is...
Researchers want to know if there is a correlation between BMI and systolic blood pressure in...
Researchers want to know if there is a correlation between BMI and systolic blood pressure in males over 50. A random sample of 9 males is selected and their data is recorded below. a) Calculate the Pearson Correlation Coefficient for these two variables and b) test whether the correlation is significantly different from 0. Run the test at a 5% level of significance. Give each of the following for part b to receive full credit: 1) the appropriate null and...
Listed below are systolic blood pressure measurements (mm Hg) taken from the right and left arms...
Listed below are systolic blood pressure measurements (mm Hg) taken from the right and left arms of the same woman. Assume that the paired sample data is a simple random sample and that the differences have a distribution that is approximately normal. Use a 0.01 significance level to test for a difference between the measurements from the two arms. What can be concluded? Right arm 152 146 134 135 138 Left arm 168 168 190 144 148 In this example,...
Using the t-Test Exercise Data Set Excel file, Look at the date set of Systolic Blood...
Using the t-Test Exercise Data Set Excel file, Look at the date set of Systolic Blood Pressure Normal Weight/Systolic Blood Pressure Obese Write a null hypothesis for the comparison (use the null hypothesis template). Also, write a directional hypothesis that reflects the anticipated outcome. Conduct a t-test two-sample assuming unequal variances using Excel. Interpret the Excel result (was it significant, what was the critical t-value, what was the calculated t-value, what should be done with the null hypothesis—accept or reject)....
- Blood Pressure For women aged 18–24, systolic blood pressures (in mm Hg) are nor- mally...
 - Blood Pressure For women aged 18–24, systolic blood pressures (in mm Hg) are nor- mally distributed with a mean of 114.8 and a standard deviation of 13.1 (based on data from the National Health Survey). Hypertension is commonly defined as a sys- tolic blood pressure above 140. a. If a woman between the ages of 18 and 24 is randomly selected, find the probabil- ity that her systolic blood pressure is greater than 140. b. If 4 women in...
 please help desperately need it
7) When subjects were treated with a drug, their systolic blood pressure readings (in mm Hg) were measured before and after the drug was taken. Results are given in the table below. Assume that the paired sample data is a simple random sample and that the differences have a distribution that is approximately normal. Using a 0.05 significance level, is there sufficient evidence to support the claim that the drug is effective in lowering systolic...
please help desperately need it
7) When subjects were treated with a drug, their systolic blood pressure readings (in mm Hg) were measured before and after the drug was taken. Results are given in the table below. Assume that the paired sample data is a simple random sample and that the differences have a distribution that is approximately normal. Using a 0.05 significance level, is there sufficient evidence to support the claim that the drug is effective in lowering systolic...
 - Blood Pressure For women aged 18–24, systolic blood pressures (in mm Hg) are nor- mally distributed with a mean of 114.8 and a standard deviation of 13.1 (based on data from the National Health Survey). Hypertension is commonly defined as a sys- tolic blood pressure above 140. a. If a woman between the ages of 18 and 24 is randomly selected, find the probabil- ity that her systolic blood pressure is greater than 140. b. If 4 women in...
Most questions answered within 3 hours.
-
Where is the error in this code sequence?
String s1 = "Hello";
String s2 = "ello";...
asked 11 months ago -
Financial data for Joel de Paris, Inc., for last year
follow:
Joel de Paris, Inc.
Balance...
asked 11 months ago -
Consider this reaction:
Al2(SO4)3 (aq)+ BaCl3
(aq) Al2Cl6 (aq)- +
3BaSO4(s) . What is the...
asked 11 months ago -
Suppose that Savneet is considering increasing her
recent random sample from 20 car rentals to 40...
asked 11 months ago -
Trucks arrive at an unloading terminal at an average rate of 120
per hour.
Trucks arrive...
asked 11 months ago -
Why are methanol and ethanol completely soluble in water while
octanol is not very little soluble....
asked 11 months ago -
A facilities manager at a university reads in a research report
that the mean amount of...
asked 11 months ago -
When the CuSO4 is rehydrated by adding water to the anhydrous
compound, is this an endothermic...
asked 11 months ago -
A ray of sunlight is passing from diamond into crown glass; the
angle of incidence is...
asked 11 months ago -
A block of mass 0.249 kg is placed on top of a light, vertical
spring of...
asked 11 months ago -
how do the kidneys compensate in the presences of acidosis
a) trigger hyperventilate
b) reserve acid...
asked 11 months ago -
Question 501 pts
The rental rate of capital to the firm increases. Which of the
following...
asked 11 months ago