
Homework Answers


Add Answer to:
QUESTION 1 a) Consider the data of Table 1.1 which specifies the "life" of 40 similar...
The data for 30 samples of 8 measurements each were collected from a process at Hawkeye...
The data for 30 samples of 8 measurements each were collected from a process at Hawkeye Plastics. They’ve asked you to create an x ̅-chart and an s-chart for the process and to interpret the results for them. a) What values will be used for the centerline, upper control limit, and lower control limit of each chart? (You only need to make a table of the values to answer this question and others like it in this assignment.) b) Create...
Single data values (in hours): 3, 1, 4, 5, 5, 2, 2.5, 3.5, 4, 4.5, 0,...
Single data values (in hours): 3, 1, 4, 5, 5, 2, 2.5, 3.5, 4, 4.5, 0, 2, 2, 2.5, 3.5, 4, 4, 4, 4, 2, 3.5, 3.5, 2, 3, 4, 4, 3, 3, 3, 1 Paired data values: Athletes Non-athletes 3.7 2.5 3.1 4.1 4.2 4.2 4.2 4.2 3.4 3.0 3.7 3.8 2.1 2.1 3.5 2.7 3.6 1.8 4.0 2.0 2.9 3.6 3.2 3.9 2.9 2.6 3.5 2.8 3.6 3.1 3.4 3.5 2.9 3.5 3.9 3.6 2.8 2.9 3.1 2.7...
1.What is the mean and the standard deviation for students with support systems? 2.What is the...
1.What is the mean and the standard deviation for students with support systems? 2.What is the mean and the standard deviation for students without support system? Students with Support System that Values Education 4 3.9 3.8 3.7 3.5 3.2 3 4 3.8 3.7 3.6 3.1 3.2 3.8 3.7 3.9 3.9 3.7 3.7 3.6 3.5 3.1 3.3 3.3 3.2 3.5 3.4 3.1 2.9 3 2.9 3.3 3.4 3.6 3.4 3.5 3.6 3.8 3.1 4 3.8 Students without Support System that Values...
Recent research indicates that the effectiveness of antidepressant medication is directly related to the severity of...
Recent research indicates that the effectiveness of antidepressant medication is directly related to the severity of the depression (Khan, Brodhead, Kolts & Brown, 2005). Based on pretreatment depression scores, patients were divided into four groups based on their level of depression. After receiving the antidepressant medication, depression scores were measured again and the amount of improvement was recorded for each patient. The following data are similar to the results of the study. Low Moderate High Moderate Moderately Severe Severe 1.2...
The table below gives the birth weights in pounds of piglets in 8 randomly selected litters...
The table below gives the birth weights in pounds of piglets in 8 randomly selected litters from large number of litters in a state. Litter 1 2 3 4 5 6 7 8 2.0 3.5 3.3 3.2 2.6 3.1 2.6 2.5 2.8 2.8 1.6 3.3 2.6 2.9 2.2 2.4 3.3 3.2 3.6 3.2 2.9 3.1 2.2 3.0 3.2 3.5 3.1 1.9 2.0 2.5 2.5 1.5 4.4 2.3 3.2 3.3 2.0 1.2 3.6 2.4 3.3 2.5 2.1 1.2 1.9 2.0 2.9 ...
Thirty-two college students, identified as having a posative attiude about Mitty Romney as compared to B....
Thirty-two college students, identified as having a posative attiude about Mitty Romney as compared to B. Obama in the 2012 presidentioal election, were asked to rate how trustworthy the face of M. Romeny appeared, as represented in their in their mental image of M. Romeny's face. Ratings were on a scale 0 to 7, with 0 being " not at all trustworthy" and 7 being "extremly trustworthy." here are the 32 ratings: 2.0 , 2.2 , 2.3 , 2.6 ,...
A product has three quality characteristics. The nominal values of these quality characteristics and their sample...
 A product has three quality characteristics. The nominal values
of these quality characteristics and their sample covariance matrix
have been determined from the analysis of 30 preliminary samples of
size n=10 as it is show in the Excel file. The sample means for
each quality characteristic for 15 additional samples of size n=10
are shown in table. Is the process in statistical control?
X2 Tz Sample number 1 2 [1.40 1.021.05] S = 1.02 1.350.98 11.05 0.98 1.20) 3.1 3.3...
A product has three quality characteristics. The nominal values
of these quality characteristics and their sample covariance matrix
have been determined from the analysis of 30 preliminary samples of
size n=10 as it is show in the Excel file. The sample means for
each quality characteristic for 15 additional samples of size n=10
are shown in table. Is the process in statistical control?
X2 Tz Sample number 1 2 [1.40 1.021.05] S = 1.02 1.350.98 11.05 0.98 1.20) 3.1 3.3...
Good Luck. (Need to show all your work to get full credit; no work, no credit)...
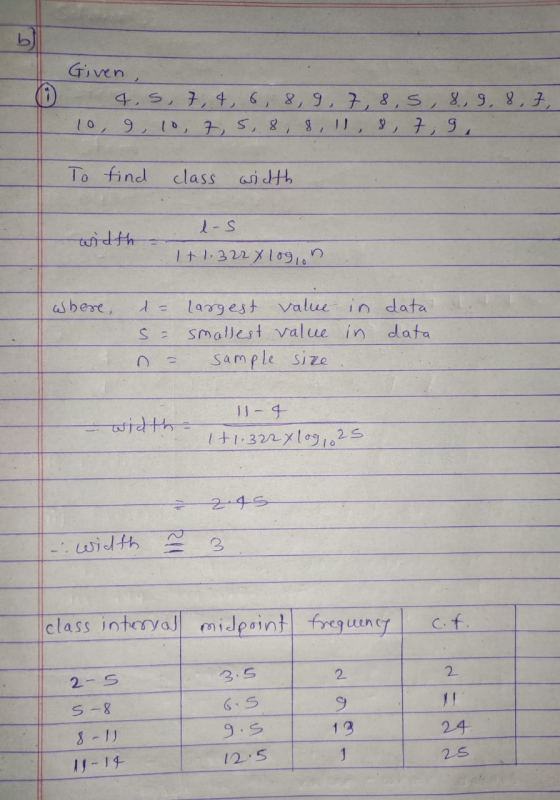
 Good Luck. (Need to show all your work to get full credit; no work, no credit) 1.For the given sample data below: a Construct a frequency distribution using six classes for a sample data that includes. Class Limits (5 pts), Class Boundaries (6 pts), Frequency (3 pts), Relative frequency (3 pts), Cumulative Frequency (3 pts), Midpoint X.5 pts), f-x-(5 pts), f. (6 pts). b. For constructed grouped data find: mean (8 pts), mode for grouped data (2 pts), modal class...
Life has been measured in years of 40 electric batteries, seven classes have been created, and...
 Life has been measured in years of 40 electric batteries, seven classes have been created, and the number of observations belonging to each class has been counted, resulting in the following table AbsoluteAccumulated Relative Accumulated Class Class (Interval)mark frequency frequencyfrequency relative frequency 2 1.7 2.2 2.7 3.4 3.7 4.2 4.7 1.5-1.9 2.0-2.4 2.5-2.9 3.0-3.4 3.5-3.9 4.0-4.4 4.5-4.9 4 15 10 3 Find the cumulative frequency (fill in the corresponding column) Find the relative frequency (fill in the corresponding column) Find...
Parametirc test or not: Test statistic: p-value: decision: Is There A Difference Between the Means?
Parametirc test or not:Test statistic:p-value:decision:Is There A Difference Between the Means?6.7 6.2 3.1 310.3 10 5 5.56.9 5.5 3.3 3.110.5 6.3 4.3 5.44.5 4.6 1.8 25.6 5.6 2 2.65.9 6.1 2.1 2.58 11.7 4 4.68 7.4 3.3 3.15.8 5.2 3.1 2.96 7.3 3.0 3.28.7 5.3 2.7 36 5.5 2.1 2.27.2 6.3 3.5 3.25.9 4.6 2.9 3.46 7.4 3 3.37.2 7.8 3.7 3.48.6 9.4 5.1 5.77.2 8.1 2.8 3.15.8 5.4 2.2 1.83.3 4 1.7 1.86.8 5.1 2 1.83.7 3.5 2.2 2.112...
 A product has three quality characteristics. The nominal values
of these quality characteristics and their sample covariance matrix
have been determined from the analysis of 30 preliminary samples of
size n=10 as it is show in the Excel file. The sample means for
each quality characteristic for 15 additional samples of size n=10
are shown in table. Is the process in statistical control?
X2 Tz Sample number 1 2 [1.40 1.021.05] S = 1.02 1.350.98 11.05 0.98 1.20) 3.1 3.3...
A product has three quality characteristics. The nominal values
of these quality characteristics and their sample covariance matrix
have been determined from the analysis of 30 preliminary samples of
size n=10 as it is show in the Excel file. The sample means for
each quality characteristic for 15 additional samples of size n=10
are shown in table. Is the process in statistical control?
X2 Tz Sample number 1 2 [1.40 1.021.05] S = 1.02 1.350.98 11.05 0.98 1.20) 3.1 3.3...
 Good Luck. (Need to show all your work to get full credit; no work, no credit) 1.For the given sample data below: a Construct a frequency distribution using six classes for a sample data that includes. Class Limits (5 pts), Class Boundaries (6 pts), Frequency (3 pts), Relative frequency (3 pts), Cumulative Frequency (3 pts), Midpoint X.5 pts), f-x-(5 pts), f. (6 pts). b. For constructed grouped data find: mean (8 pts), mode for grouped data (2 pts), modal class...
 Life has been measured in years of 40 electric batteries, seven classes have been created, and the number of observations belonging to each class has been counted, resulting in the following table AbsoluteAccumulated Relative Accumulated Class Class (Interval)mark frequency frequencyfrequency relative frequency 2 1.7 2.2 2.7 3.4 3.7 4.2 4.7 1.5-1.9 2.0-2.4 2.5-2.9 3.0-3.4 3.5-3.9 4.0-4.4 4.5-4.9 4 15 10 3 Find the cumulative frequency (fill in the corresponding column) Find the relative frequency (fill in the corresponding column) Find...
Most questions answered within 3 hours.
-
Where is the error in this code sequence?
String s1 = "Hello";
String s2 = "ello";...
asked 10 months ago -
Financial data for Joel de Paris, Inc., for last year
follow:
Joel de Paris, Inc.
Balance...
asked 10 months ago -
Consider this reaction:
Al2(SO4)3 (aq)+ BaCl3
(aq) Al2Cl6 (aq)- +
3BaSO4(s) . What is the...
asked 10 months ago -
Suppose that Savneet is considering increasing her
recent random sample from 20 car rentals to 40...
asked 10 months ago -
Trucks arrive at an unloading terminal at an average rate of 120
per hour.
Trucks arrive...
asked 10 months ago -
Why are methanol and ethanol completely soluble in water while
octanol is not very little soluble....
asked 10 months ago -
A facilities manager at a university reads in a research report
that the mean amount of...
asked 10 months ago -
When the CuSO4 is rehydrated by adding water to the anhydrous
compound, is this an endothermic...
asked 10 months ago -
A ray of sunlight is passing from diamond into crown glass; the
angle of incidence is...
asked 10 months ago -
A block of mass 0.249 kg is placed on top of a light, vertical
spring of...
asked 10 months ago -
how do the kidneys compensate in the presences of acidosis
a) trigger hyperventilate
b) reserve acid...
asked 10 months ago -
Question 501 pts
The rental rate of capital to the firm increases. Which of the
following...
asked 10 months ago