The data from a calcium binding experiment are provided. Calcium is the log of free calcium...
The data from a calcium binding experiment are provided. Calcium is the log of free calcium concentration and ProteinProp is the proportion of the protein bound the calcium.
| Calcium | ProteinProp |
| -10.14539036 | 0.145164202 |
| -9.97798426 | 0.223711498 |
| -9.351249787 | 0.219828821 |
| -9.101000729 | 0.334269431 |
| -9.01376587 | 0.378526213 |
| -8.940436582 | 0.409369052 |
| -8.578231599 | 0.507444972 |
| -8.370182804 | 0.57164134 |
| -8.289036881 | 0.642186965 |
| -7.959793372 | 0.807279963 |
| -7.592269272 | 0.930025173 |
| -7.238448011 | 0.901409641 |
| -7.038626372 | 0.950327606 |
| -6.330776126 | 0.957320456 |
| -6.167235695 | 0.985104489 |
| -5.556893543 | 0.969407033 |
| -5.321208566 | 0.999285187 |
| -4.813608784 | 1 |
| -10.14539036 | 0.188284071 |
| -9.97798426 | 0.226840832 |
| -9.351249787 | 0.299825094 |
| -9.101000729 | 0.351716328 |
| -9.01376587 | 0.413916136 |
| -8.940436582 | 0.437475476 |
| -8.578231599 | 0.526377071 |
| -8.370182804 | 0.619739975 |
| -8.289036881 | 0.670996494 |
| -7.959793372 | 0.844443513 |
| -7.592269272 | 0.929812237 |
| -7.238448011 | 0.979803174 |
| -7.038626372 | 0.974212892 |
| -6.330776126 | 0.974230866 |
| -6.167235695 | 0.987524724 |
| -5.556893543 | 0.998230049 |
| -5.321208566 | 1 |
| -4.813608784 | 0.995714469 |
| -10.72193267 | 0.264766386 |
| -10.44575319 | 0.336968113 |
| -9.689731633 | 0.401104 |
| -9.047837426 | 0.397172676 |
| -8.791558644 | 0.535642225 |
| -8.448916135 | 0.648687709 |
| -8.08820341 | 0.668027433 |
| -7.851397345 | 0.805547503 |
| -7.658565475 | 0.858684464 |
| -7.482276405 | 0.879804722 |
| -7.306448914 | 1 |
| -7.115544504 | 0.977186242 |
| -6.884056823 | 0.965169616 |
| -6.539854183 | 0.964522047 |
| -5.86518563 | 0.98589626 |
a. Fit a quadratic regression model for predicting ProteinProp from Calcium. Write down the fitted regression equation.of
b. Add the quadratic curve to a scatterplot of ProteinProp versus Calcium
c. Are the conditions for inference reasonably satisfied for this model?
d. Is the parameter for the quadratic term significantly fifferent from zero? Justify.
e. Identify the coefficient of multiple determination and interpret this value
Homework Answers
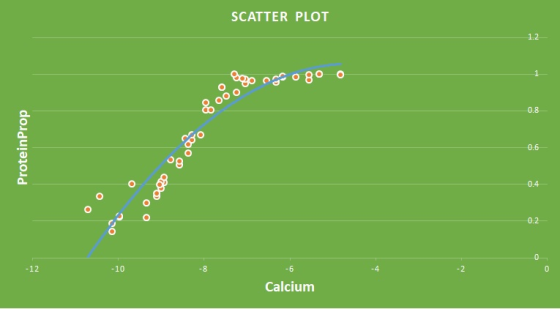

a.The regression equation
Y(ProteinPrep)= 1.429 - 0.011*(Calcium^2)
c.the conditions for inference reasonably satisfied for this model
d.the pvalue is approximately 0 which means the parameter is not significantly 0
e.Coeff of multiple determination = R-Sq=0.8741
which means 87.41% of total variation of proteinPrep is explained by calcium
Please Give A Thumbs Up
Add Answer to:
The data from a calcium binding experiment are provided. Calcium
is the log of free calcium...
2. Suppose Y ~ Exp(a), which has pdf f(y)-1 exp(-y/a). (a) Use the following R code to generate data from the model Yi...
 2. Suppose Y ~ Exp(a), which has pdf f(y)-1 exp(-y/a). (a) Use the following R code to generate data from the model Yi ~ Exp(0.05/Xi), and provide the scatterplot of Y against X set.seed(123) n <- 500 <-rnorm (n, x 3, 1) Y <- rexp(n, X) (b) Fit the model Yi-Ao + Ax, + ε¡ using the lm function in R and provide a plot of the best fit line on the scatterplot of Y vs X, and the residual...
2. The data set prostate in the faraway package is from a study on 97 men...
 2. The data set prostate in the faraway package is from a study on 97 men with prostate cancer who were due to receive a radical prostatectomy. We are interest is in predicting lpsa (log prostate specific antigen) with lcavol (log cancer volume). (a) Draw a scatterplot - does a simple linear regression model seem reasonable? (b) Without using the R function Im(0, compute the values , Y,Sxx, Syy and Sxy. Com pute the ordinary least squares estimates of the...
2. R programming 2·The data set prostate in the faraway package is froma study on 97...
 2. R programming
2·The data set prostate in the faraway package is froma study on 97 men with prostate cancer who were due to receive a radical prostatectomy We are interest is in predicting lpsa (log prostate specific antigen) with Icavol (log cancer volume). (a) Draw a scatterplot -does a simple linear regression model seem reasonable? (b) Without using the R function Im), compute the values T,Y, Sxx, Syy and Sxy. Com- pute the ordinary least squares estimates of the...
2. R programming
2·The data set prostate in the faraway package is froma study on 97 men with prostate cancer who were due to receive a radical prostatectomy We are interest is in predicting lpsa (log prostate specific antigen) with Icavol (log cancer volume). (a) Draw a scatterplot -does a simple linear regression model seem reasonable? (b) Without using the R function Im), compute the values T,Y, Sxx, Syy and Sxy. Com- pute the ordinary least squares estimates of the...
1. The experiment earlier this week from one of the rounds gave the following results: 3...
 1. The experiment earlier this week from one of the rounds gave the following results: 3 2.8 2.6 Q 2.4 22 2 1.8 3 4 5 6 7 Costs Running the regression yielded the following function: 0 = 3.15-0.122Cost: p=0.4526 (0.001) (0.21) Where the p-values are in the parenthesis. a. Interpret the slope coefficient. b. What is the significance level for the slope coefficient? c. Suppose you wanted to add a quadratic term to the model. Given the following data,...
If Possible, please use MiniTab to get answer!!!Full Data Set: Toxicity experiment. In an experiment testing...
 If Possible, please use MiniTab to get
answer!!!Full Data Set:
Toxicity experiment. In an experiment testing the effect of a toxic substance, 1,500 experi- mental insects were divided at random into six groups of 250 each. The insects in each group were exposed to a fixed dose of the toxic substance. A day later, each insect was observed Death from exposure was scored 1, and survival was scored 0. The results are shown below; Xj denotes the dose level (on...
If Possible, please use MiniTab to get
answer!!!Full Data Set:
Toxicity experiment. In an experiment testing the effect of a toxic substance, 1,500 experi- mental insects were divided at random into six groups of 250 each. The insects in each group were exposed to a fixed dose of the toxic substance. A day later, each insect was observed Death from exposure was scored 1, and survival was scored 0. The results are shown below; Xj denotes the dose level (on...
The accompanying data are from a football league for one season. a. Construct a scatter diagram...
 The accompanying data are from a football league for one season. a. Construct a scatter diagram for points/game and yards/game. Does there appear to be a linear relationship? b. Use the Regression tool to develop a model for predicting points/game as a function of yards/game. Explain the statistical significance of the model and the R? value. Click the icon to view the football data. a. Choose the correct scatter diagram below. ОА. B. O c. OD. a a Q 40-...
The accompanying data resulted from a study of the relationship between y = brightness of finished...
 The accompanying data resulted from a study of the relationship between y = brightness of finished paper and the independent variables x1 = hydrogen peroxide (% by weight), x2 = sodium hydroxide (% by weight), x3 = silicate % by weight), and X4 = process temperature. y 0.1 0.3 2.5 160 82.9 0.2 0.2 1.5 145 83.9 0.4 0.2 1.5 145 84.9 0.5 0.3 2.5 160 85.5 0.3 0.1 2.5 160 85.2 0.2 0.4 1.5 145 83.4 0.4 | 0.4...
Applying Simple Linear Regression to Your favorite Data. Many dependent variables in business serve as the...
Applying Simple Linear Regression to Your favorite Data. Many dependent variables in business serve as the subjects of regression modeling efforts. We list such variables here: Rate of return of a stock Annual unemployment rate Grade point average of an accounting student Gross domestic product of a country Salary cap space available for your favorite NFL team Choose one of these dependent variables, or choose some other dependent variable, for which you want to construct a prediction model. There may...
Need help with stats true or false questions Decide (with short explanations) whether the following statements are true or false a) We consider the model y-Ao +A(z) +E. Let (-0.01, 1.5) be a 95% con...
 Need help with stats true or false questions
Decide (with short explanations) whether the following statements are true or false a) We consider the model y-Ao +A(z) +E. Let (-0.01, 1.5) be a 95% confidence interval for A In this case, a t-test with significance level 1% rejects the null hypothesis Ho : A-0 against a two sided alternative. b) Complicated models with a lot of parameters are better for prediction then simple models with just a few parameters c)...
Need help with stats true or false questions
Decide (with short explanations) whether the following statements are true or false a) We consider the model y-Ao +A(z) +E. Let (-0.01, 1.5) be a 95% confidence interval for A In this case, a t-test with significance level 1% rejects the null hypothesis Ho : A-0 against a two sided alternative. b) Complicated models with a lot of parameters are better for prediction then simple models with just a few parameters c)...
Help & explain please Regression 1. A researcher is willing to investigate whether there is any...
 Help & explain please
Regression 1. A researcher is willing to investigate whether there is any linear relation bet ween income (x) in thousand dollars and food expenditures (y) in hundred dollars. A sample data on 7 households given the table below was collected. Assuming that a linear model is used to solve the problem. r-3-D) r-I 83 24 13 61 15 17 1. Write down the linear model 2. Write down the fitted regression line and Interpret the slope...
Help & explain please
Regression 1. A researcher is willing to investigate whether there is any linear relation bet ween income (x) in thousand dollars and food expenditures (y) in hundred dollars. A sample data on 7 households given the table below was collected. Assuming that a linear model is used to solve the problem. r-3-D) r-I 83 24 13 61 15 17 1. Write down the linear model 2. Write down the fitted regression line and Interpret the slope...
 2. Suppose Y ~ Exp(a), which has pdf f(y)-1 exp(-y/a). (a) Use the following R code to generate data from the model Yi ~ Exp(0.05/Xi), and provide the scatterplot of Y against X set.seed(123) n <- 500 <-rnorm (n, x 3, 1) Y <- rexp(n, X) (b) Fit the model Yi-Ao + Ax, + ε¡ using the lm function in R and provide a plot of the best fit line on the scatterplot of Y vs X, and the residual...
 2. The data set prostate in the faraway package is from a study on 97 men with prostate cancer who were due to receive a radical prostatectomy. We are interest is in predicting lpsa (log prostate specific antigen) with lcavol (log cancer volume). (a) Draw a scatterplot - does a simple linear regression model seem reasonable? (b) Without using the R function Im(0, compute the values , Y,Sxx, Syy and Sxy. Com pute the ordinary least squares estimates of the...
 2. R programming
2·The data set prostate in the faraway package is froma study on 97 men with prostate cancer who were due to receive a radical prostatectomy We are interest is in predicting lpsa (log prostate specific antigen) with Icavol (log cancer volume). (a) Draw a scatterplot -does a simple linear regression model seem reasonable? (b) Without using the R function Im), compute the values T,Y, Sxx, Syy and Sxy. Com- pute the ordinary least squares estimates of the...
2. R programming
2·The data set prostate in the faraway package is froma study on 97 men with prostate cancer who were due to receive a radical prostatectomy We are interest is in predicting lpsa (log prostate specific antigen) with Icavol (log cancer volume). (a) Draw a scatterplot -does a simple linear regression model seem reasonable? (b) Without using the R function Im), compute the values T,Y, Sxx, Syy and Sxy. Com- pute the ordinary least squares estimates of the...
 1. The experiment earlier this week from one of the rounds gave the following results: 3 2.8 2.6 Q 2.4 22 2 1.8 3 4 5 6 7 Costs Running the regression yielded the following function: 0 = 3.15-0.122Cost: p=0.4526 (0.001) (0.21) Where the p-values are in the parenthesis. a. Interpret the slope coefficient. b. What is the significance level for the slope coefficient? c. Suppose you wanted to add a quadratic term to the model. Given the following data,...
 If Possible, please use MiniTab to get
answer!!!Full Data Set:
Toxicity experiment. In an experiment testing the effect of a toxic substance, 1,500 experi- mental insects were divided at random into six groups of 250 each. The insects in each group were exposed to a fixed dose of the toxic substance. A day later, each insect was observed Death from exposure was scored 1, and survival was scored 0. The results are shown below; Xj denotes the dose level (on...
If Possible, please use MiniTab to get
answer!!!Full Data Set:
Toxicity experiment. In an experiment testing the effect of a toxic substance, 1,500 experi- mental insects were divided at random into six groups of 250 each. The insects in each group were exposed to a fixed dose of the toxic substance. A day later, each insect was observed Death from exposure was scored 1, and survival was scored 0. The results are shown below; Xj denotes the dose level (on...
 The accompanying data are from a football league for one season. a. Construct a scatter diagram for points/game and yards/game. Does there appear to be a linear relationship? b. Use the Regression tool to develop a model for predicting points/game as a function of yards/game. Explain the statistical significance of the model and the R? value. Click the icon to view the football data. a. Choose the correct scatter diagram below. ОА. B. O c. OD. a a Q 40-...
 The accompanying data resulted from a study of the relationship between y = brightness of finished paper and the independent variables x1 = hydrogen peroxide (% by weight), x2 = sodium hydroxide (% by weight), x3 = silicate % by weight), and X4 = process temperature. y 0.1 0.3 2.5 160 82.9 0.2 0.2 1.5 145 83.9 0.4 0.2 1.5 145 84.9 0.5 0.3 2.5 160 85.5 0.3 0.1 2.5 160 85.2 0.2 0.4 1.5 145 83.4 0.4 | 0.4...
 Need help with stats true or false questions
Decide (with short explanations) whether the following statements are true or false a) We consider the model y-Ao +A(z) +E. Let (-0.01, 1.5) be a 95% confidence interval for A In this case, a t-test with significance level 1% rejects the null hypothesis Ho : A-0 against a two sided alternative. b) Complicated models with a lot of parameters are better for prediction then simple models with just a few parameters c)...
Need help with stats true or false questions
Decide (with short explanations) whether the following statements are true or false a) We consider the model y-Ao +A(z) +E. Let (-0.01, 1.5) be a 95% confidence interval for A In this case, a t-test with significance level 1% rejects the null hypothesis Ho : A-0 against a two sided alternative. b) Complicated models with a lot of parameters are better for prediction then simple models with just a few parameters c)...
 Help & explain please
Regression 1. A researcher is willing to investigate whether there is any linear relation bet ween income (x) in thousand dollars and food expenditures (y) in hundred dollars. A sample data on 7 households given the table below was collected. Assuming that a linear model is used to solve the problem. r-3-D) r-I 83 24 13 61 15 17 1. Write down the linear model 2. Write down the fitted regression line and Interpret the slope...
Help & explain please
Regression 1. A researcher is willing to investigate whether there is any linear relation bet ween income (x) in thousand dollars and food expenditures (y) in hundred dollars. A sample data on 7 households given the table below was collected. Assuming that a linear model is used to solve the problem. r-3-D) r-I 83 24 13 61 15 17 1. Write down the linear model 2. Write down the fitted regression line and Interpret the slope...
Most questions answered within 3 hours.
-
Where is the error in this code sequence?
String s1 = "Hello";
String s2 = "ello";...
asked 10 months ago -
Financial data for Joel de Paris, Inc., for last year
follow:
Joel de Paris, Inc.
Balance...
asked 10 months ago -
Consider this reaction:
Al2(SO4)3 (aq)+ BaCl3
(aq) Al2Cl6 (aq)- +
3BaSO4(s) . What is the...
asked 10 months ago -
Suppose that Savneet is considering increasing her
recent random sample from 20 car rentals to 40...
asked 10 months ago -
Trucks arrive at an unloading terminal at an average rate of 120
per hour.
Trucks arrive...
asked 10 months ago -
Why are methanol and ethanol completely soluble in water while
octanol is not very little soluble....
asked 10 months ago -
A facilities manager at a university reads in a research report
that the mean amount of...
asked 10 months ago -
When the CuSO4 is rehydrated by adding water to the anhydrous
compound, is this an endothermic...
asked 10 months ago -
A ray of sunlight is passing from diamond into crown glass; the
angle of incidence is...
asked 10 months ago -
A block of mass 0.249 kg is placed on top of a light, vertical
spring of...
asked 10 months ago -
how do the kidneys compensate in the presences of acidosis
a) trigger hyperventilate
b) reserve acid...
asked 10 months ago -
Question 501 pts
The rental rate of capital to the firm increases. Which of the
following...
asked 10 months ago