11- What is the test statistic for testing the overall linear (the test outlined in question...
11- What is the test statistic for testing the overall linear (the test outlined in question 10)?
Select one:
a. 1.86×10⁻¹¹
b. 22
c. 0.35
d. 7.64
e. -0.21
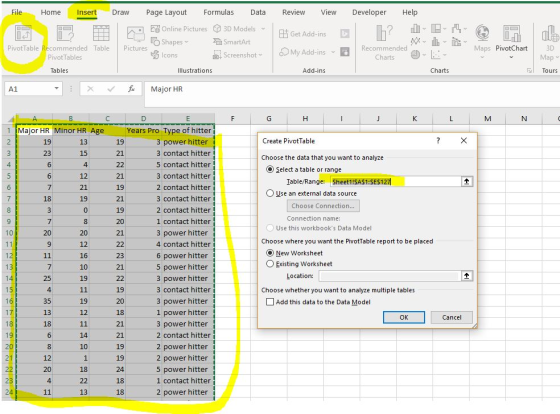
Create a pivot table to display how does the type of hitter and years of experience influence the number of major home runs. What is the average number of major home runs for power hitters that have 2 or less years of experience (0, 1 or 2 years of experience)? (hint: “grouping” would be helpful)
Select one:
a. 10
b. 17.78
c. 13.89
d. 15.6
e. 13.15
17- Including the new variable for type of the hitter inside the regression model, which of the following is true when comparing power hitters with contact hitters,when other predictor variables are held constant?
Select one:
a. The difference in major home run hits between the two types of hitters is not significant
b. Power hitters have 3.58 MORE major home run hits than contact hitters on average
c. Power hitters have 3.58 LESS major home run hits than contact hitters on average
d. Power hitters have 4.5 MORE major home run hits than contact hitters on average
e. Power hitters have 4.5 LESS major home run hits than contact hitters on average
| Major HR | Minor HR | Age | Years Pro | Type of hitter |
| 19 | 13 | 19 | 3 | power hitter |
| 23 | 15 | 21 | 3 | contact hitter |
| 6 | 4 | 22 | 5 | contact hitter |
| 6 | 12 | 21 | 3 | contact hitter |
| 7 | 21 | 19 | 2 | contact hitter |
| 18 | 19 | 21 | 3 | contact hitter |
| 3 | 0 | 19 | 2 | contact hitter |
| 7 | 8 | 20 | 1 | contact hitter |
| 20 | 20 | 21 | 3 | power hitter |
| 9 | 12 | 22 | 4 | contact hitter |
| 11 | 16 | 23 | 6 | power hitter |
| 7 | 10 | 21 | 5 | power hitter |
| 25 | 19 | 22 | 3 | power hitter |
| 4 | 11 | 19 | 3 | contact hitter |
| 35 | 19 | 20 | 3 | power hitter |
| 13 | 12 | 18 | 1 | power hitter |
| 18 | 11 | 21 | 3 | power hitter |
| 6 | 14 | 21 | 2 | contact hitter |
| 8 | 10 | 19 | 2 | power hitter |
| 12 | 1 | 19 | 2 | power hitter |
| 20 | 18 | 24 | 5 | power hitter |
| 4 | 22 | 18 | 1 | contact hitter |
| 11 | 13 | 18 | 2 | power hitter |
| 32 | 20 | 23 | 5 | power hitter |
| 2 | 4 | 19 | 2 | contact hitter |
| 22 | 16 | 20 | 4 | power hitter |
| 2 | 2 | 19 | 2 | contact hitter |
| 2 | 2 | 21 | 2 | contact hitter |
| 9 | 9 | 20 | 2 | power hitter |
| 32 | 19 | 19 | 2 | power hitter |
| 3 | 6 | 19 | 1 | contact hitter |
| 10 | 9 | 23 | 6 | contact hitter |
| 5 | 6 | 21 | 4 | contact hitter |
| 24 | 18 | 20 | 2 | power hitter |
| 10 | 12 | 21 | 3 | contact hitter |
| 10 | 11 | 22 | 3 | contact hitter |
| 19 | 12 | 21 | 3 | contact hitter |
| 2 | 1 | 23 | 4 | contact hitter |
| 16 | 10 | 21 | 3 | contact hitter |
| 11 | 26 | 19 | 4 | contact hitter |
| 28 | 15 | 23 | 3 | power hitter |
| 20 | 13 | 24 | 7 | contact hitter |
| 18 | 12 | 24 | 4 | power hitter |
| 9 | 14 | 21 | 3 | contact hitter |
| 0 | 5 | 18 | 0 | contact hitter |
| 10 | 12 | 22 | 2 | contact hitter |
| 20 | 29 | 19 | 2 | contact hitter |
| 11 | 10 | 20 | 2 | power hitter |
| 12 | 10 | 22 | 3 | contact hitter |
| 8 | 19 | 20 | 4 | power hitter |
| 12 | 9 | 23 | 5 | contact hitter |
| 21 | 13 | 21 | 4 | power hitter |
| 11 | 11 | 21 | 2 | power hitter |
| 28 | 24 | 21 | 3 | power hitter |
| 4 | 7 | 20 | 2 | power hitter |
| 38 | 22 | 19 | 2 | power hitter |
| 8 | 7 | 23 | 5 | power hitter |
| 7 | 8 | 21 | 4 | contact hitter |
| 4 | 6 | 18 | 1 | power hitter |
| 15 | 11 | 23 | 6 | contact hitter |
| 12 | 12 | 18 | 1 | power hitter |
| 3 | 3 | 19 | 3 | contact hitter |
| 8 | 12 | 18 | 1 | contact hitter |
| 3 | 0 | 21 | 2 | contact hitter |
| 24 | 22 | 22 | 4 | power hitter |
| 23 | 14 | 23 | 5 | power hitter |
| 17 | 12 | 18 | 1 | power hitter |
| 22 | 17 | 23 | 4 | power hitter |
| 23 | 12 | 24 | 6 | contact hitter |
| 12 | 11 | 23 | 5 | contact hitter |
| 6 | 8 | 19 | 2 | contact hitter |
| 34 | 23 | 20 | 2 | power hitter |
| 5 | 15 | 20 | 4 | power hitter |
| 21 | 13 | 22 | 3 | power hitter |
| 13 | 24 | 21 | 2 | power hitter |
| 4 | 5 | 24 | 3 | power hitter |
| 8 | 17 | 23 | 4 | contact hitter |
| 20 | 11 | 21 | 4 | contact hitter |
| 17 | 10 | 20 | 4 | contact hitter |
| 11 | 19 | 23 | 4 | contact hitter |
| 23 | 25 | 23 | 3 | power hitter |
| 7 | 28 | 23 | 3 | power hitter |
| 5 | 2 | 23 | 3 | contact hitter |
| 25 | 12 | 24 | 4 | contact hitter |
| 12 | 25 | 20 | 2 | contact hitter |
| 6 | 7 | 20 | 1 | power hitter |
| 21 | 17 | 22 | 5 | contact hitter |
| 28 | 26 | 23 | 2 | power hitter |
| 7 | 5 | 23 | 5 | contact hitter |
| 21 | 11 | 19 | 3 | contact hitter |
| 5 | 13 | 20 | 3 | power hitter |
| 22 | 21 | 20 | 2 | contact hitter |
| 7 | 6 | 21 | 3 | contact hitter |
| 3 | 6 | 21 | 3 | contact hitter |
| 7 | 8 | 22 | 4 | contact hitter |
| 13 | 14 | 18 | 2 | power hitter |
| 15 | 12 | 24 | 7 | contact hitter |
| 26 | 20 | 20 | 2 | power hitter |
| 18 | 10 | 24 | 4 | contact hitter |
| 4 | 7 | 19 | 1 | contact hitter |
| 19 | 14 | 22 | 4 | power hitter |
| 16 | 33 | 22 | 3 | power hitter |
| 12 | 21 | 21 | 2 | contact hitter |
| 10 | 14 | 18 | 1 | power hitter |
| 23 | 12 | 20 | 4 | power hitter |
| 6 | 9 | 23 | 3 | contact hitter |
| 16 | 15 | 19 | 2 | contact hitter |
| 10 | 24 | 22 | 3 | contact hitter |
| 3 | 0 | 22 | 4 | power hitter |
| 2 | 7 | 19 | 2 | contact hitter |
| 17 | 12 | 24 | 6 | power hitter |
| 6 | 11 | 19 | 2 | power hitter |
| 19 | 12 | 19 | 3 | power hitter |
| 6 | 5 | 24 | 4 | contact hitter |
| 10 | 9 | 20 | 2 | contact hitter |
| 6 | 18 | 21 | 3 | power hitter |
| 3 | 2 | 20 | 2 | contact hitter |
| 11 | 11 | 20 | 2 | power hitter |
| 18 | 10 | 19 | 1 | contact hitter |
| 4 | 6 | 21 | 2 | contact hitter |
| 6 | 12 | 21 | 3 | contact hitter |
| 29 | 31 | 21 | 2 | power hitter |
| 12 | 16 | 18 | 2 | contact hitter |
| 7 | 22 | 20 | 2 | contact hitter |
| 8 | 35 | 20 | 1 | power hitter |
| 30 | 23 | 23 | 3 | power hitter |
Homework Answers
The first and third questions are related to some pervious question, hence need more information to solve it.
Second quesiton solved.
Create a pivot table to display how does the type of hitter and
years of experience influence the number of major home runs. What
is the average number of major home runs for power hitters that
have 2 or less years of experience (0, 1 or 2 years of experience)?
(hint: “grouping” would be helpful)
e. 13.15
How to get the answer.
Step 1 : Put the data in excel and highlight as shown.
Go to insert -> Pivot table and you will the create Pivot table
input window. Check that the entire data is selected.
Step 2 : You get a new sheet as shown below
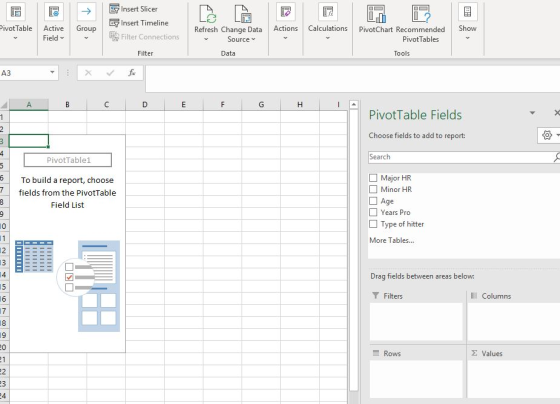
Step 3 : We need to filter type of hitter and select the number of years of experience. Hence drag and put both these field in the filter box. As shown
Next we need the average number of major home runs the values box

Step 4 : We get the sum of the all the Home runs , we need the average, there we do the following get the needed result
Right click on Sum of Major HR and select Value Field settings.

In the window that come select Average and we get the needed
value.

final answer

Add Answer to:
11- What is the test statistic for testing the overall linear
(the test outlined in question...
Statistics - Test Statistic
Jennifer’s manager Dr. Jonathan Steinberg wonders whether Healthy Life members needed more chiropractic help in 2020 than in 2019, on average. Jennifer selected a random sample of those who were treated by chiropractic doctors in both years. Data provided. Please help Jennifer Nguyen to check whether annual expenses and number of visits increased, on average. For both tests use Data Analysis t-Test: Paired Two Sample for Means and 5% significance level. Jennifer Nguyen and her manager know that in both...
s. QUESTION 2 Use minitab Suppose a sample of 20 students were given a diagnostic test...
 s.
QUESTION 2 Use minitab Suppose a sample of 20 students were given a diagnostic test before studying a particular module and then again after completing the module. We want to find out if, in general, our teaching leads to improvements in students' knowledge/skills (i.e. test scores). We can use the results from our sample of students to draw conclusions about the impact of this module in general. 92.MPJ 1) check assumption (fort show your correct 3) find the t-value...
s.
QUESTION 2 Use minitab Suppose a sample of 20 students were given a diagnostic test before studying a particular module and then again after completing the module. We want to find out if, in general, our teaching leads to improvements in students' knowledge/skills (i.e. test scores). We can use the results from our sample of students to draw conclusions about the impact of this module in general. 92.MPJ 1) check assumption (fort show your correct 3) find the t-value...
Game Point_Differential Assists Rebounds Turnovers Personal_Fouls 1 15 15 38 11 9 2 36 20 43 &
 Game
Point_Differential Assists
Rebounds Turnovers Personal_Fouls
1 15 15 38
11 9
2 36 20 43
8 13
3 16 21 29
7 13
4 45 22 46
11 11
5 12 11 40
7 22
6 -10 10 31
13 26
7 11 19 45
11 7
8 12 16 32
16 14
9 3 16 27
18 15
10 19 9 34
17 17
11 40 16 41
9 17
12 44 12 29
9 22
13 16 ...
Game
Point_Differential Assists
Rebounds Turnovers Personal_Fouls
1 15 15 38
11 9
2 36 20 43
8 13
3 16 21 29
7 13
4 45 22 46
11 11
5 12 11 40
7 22
6 -10 10 31
13 26
7 11 19 45
11 7
8 12 16 32
16 14
9 3 16 27
18 15
10 19 9 34
17 17
11 40 16 41
9 17
12 44 12 29
9 22
13 16 ...
Magic Square question for Python
You have this solution in Java, I am interested in this same solution for Python.One interesting application of two-dimensional arrays is magic squares. A magic square is a square matrix in which the sum of every row, every column, and bothdiagonals is the same. Magic squares have been studied for many years, and there are some particularly famous magic squares. In this exercise you will write code todetermine whether a square is magic.You should find that the first, second, and...
Review the 6 karyotypes in Figure 10 and determine the chromosomal disorder. Record the chromosomal disorder...
 Review the 6 karyotypes in Figure 10 and determine the
chromosomal disorder. Record the chromosomal disorder in
Data Table 3.
Describe the genotype of each chromosomal disorder and record
in Data Table 3.
Describe the phenotype of each chromosomal disorder and record
in Data Table 3.
Data Table 3: Karyotype to Genotype to Phenotype
#
Chromosomal Disorder
Genotype
Phenotype
1
2
3
4
5
6
1 2 3 4 5 6 7 8 1 2 3 4 5 6 7...
Review the 6 karyotypes in Figure 10 and determine the
chromosomal disorder. Record the chromosomal disorder in
Data Table 3.
Describe the genotype of each chromosomal disorder and record
in Data Table 3.
Describe the phenotype of each chromosomal disorder and record
in Data Table 3.
Data Table 3: Karyotype to Genotype to Phenotype
#
Chromosomal Disorder
Genotype
Phenotype
1
2
3
4
5
6
1 2 3 4 5 6 7 8 1 2 3 4 5 6 7...
Graph the mean winning margins for years 2005 - 2007 for women's NCAA Basketball tournaments. Is...
Graph the mean winning margins for years 2005 - 2007 for women's NCAA Basketball tournaments. Is there a trend over time? 2005 Winning Margin 34 3 1 8 26 17 22 32 35 3 22 10 22 31 3 21 51 12 2 20 5 25 10 41 32 16 23 10 33 48 12 37 2006 Winning Margin 24 12 13 21 4 5 15 48 23 17 5 19 24 18 10 41 69 2 10 19 6...
Suppose there are 100 identical firms in the market and the luggage industry is perfectly competitive....
 Suppose there are 100 identical firms in the market and the luggage industry is perfectly competitive. What does the market supply curve look like? 20 19 18 17 16 15 14 13 12 11 A 10 9 8 7 6 5 4 20 19 18 17 16 15 14 13 12 11 A 10 8 7 6 2 1 0 0 0 1 2 3 4 5 6 7 8 9 10 11 12 0 1 2 3 4 5...
1. estimate a linear cost function 2. estimate a quadratic cost function 3. estimate a cubric...
 1. estimate a linear cost function
2. estimate a quadratic cost function
3. estimate a cubric cost function
1 A B с D 1 Cost data for a lumber mill 2 3 TC 4 11 5 32 2 6 93 3 7 248 4 8 575 5 9 1176 6 10 2177 7 11 3728 8 12 6003 9 13 9200 10 14 13541 11 15 19272 12 1626663 13 17 36008 14 18 47625 15 19 61856 16 20...
1. estimate a linear cost function
2. estimate a quadratic cost function
3. estimate a cubric cost function
1 A B с D 1 Cost data for a lumber mill 2 3 TC 4 11 5 32 2 6 93 3 7 248 4 8 575 5 9 1176 6 10 2177 7 11 3728 8 12 6003 9 13 9200 10 14 13541 11 15 19272 12 1626663 13 17 36008 14 18 47625 15 19 61856 16 20...
Assembly Language Programming Assignment program must be in: MASM assembly language / x86 architecture / irvine...
Assembly Language Programming Assignment program must be in: MASM assembly language / x86 architecture / irvine library procedures Objectives: 1. using register indirect addressing 2. passing parameters 3. generating “random” numbers 4. working with arrays Description: Write and test a MASM program to perform the following tasks: 1. Introduce the program. 2. Generate ARRAYSIZE random integers in the range [LO = 10 .. HI = 29], storing them in consecutive elements of an array. ARRAYSIZE should be set to 200....
I posted this question earlier but realized that the code was not easy to test since...
I posted this question earlier but realized that the code was not easy to test since it was just screenshots and not text so I am reposting it: I'm very new at working with file streams, and I'm having trouble with a HW assignment I have to work on. For the assignment I have to read an input file named "MagicSquaresIn.txt" (included at the bottom) and I have to check whether they are normal, associative, and panmagic. To check that...
 s.
QUESTION 2 Use minitab Suppose a sample of 20 students were given a diagnostic test before studying a particular module and then again after completing the module. We want to find out if, in general, our teaching leads to improvements in students' knowledge/skills (i.e. test scores). We can use the results from our sample of students to draw conclusions about the impact of this module in general. 92.MPJ 1) check assumption (fort show your correct 3) find the t-value...
s.
QUESTION 2 Use minitab Suppose a sample of 20 students were given a diagnostic test before studying a particular module and then again after completing the module. We want to find out if, in general, our teaching leads to improvements in students' knowledge/skills (i.e. test scores). We can use the results from our sample of students to draw conclusions about the impact of this module in general. 92.MPJ 1) check assumption (fort show your correct 3) find the t-value...
 Game
Point_Differential Assists
Rebounds Turnovers Personal_Fouls
1 15 15 38
11 9
2 36 20 43
8 13
3 16 21 29
7 13
4 45 22 46
11 11
5 12 11 40
7 22
6 -10 10 31
13 26
7 11 19 45
11 7
8 12 16 32
16 14
9 3 16 27
18 15
10 19 9 34
17 17
11 40 16 41
9 17
12 44 12 29
9 22
13 16 ...
Game
Point_Differential Assists
Rebounds Turnovers Personal_Fouls
1 15 15 38
11 9
2 36 20 43
8 13
3 16 21 29
7 13
4 45 22 46
11 11
5 12 11 40
7 22
6 -10 10 31
13 26
7 11 19 45
11 7
8 12 16 32
16 14
9 3 16 27
18 15
10 19 9 34
17 17
11 40 16 41
9 17
12 44 12 29
9 22
13 16 ...
 Review the 6 karyotypes in Figure 10 and determine the
chromosomal disorder. Record the chromosomal disorder in
Data Table 3.
Describe the genotype of each chromosomal disorder and record
in Data Table 3.
Describe the phenotype of each chromosomal disorder and record
in Data Table 3.
Data Table 3: Karyotype to Genotype to Phenotype
#
Chromosomal Disorder
Genotype
Phenotype
1
2
3
4
5
6
1 2 3 4 5 6 7 8 1 2 3 4 5 6 7...
Review the 6 karyotypes in Figure 10 and determine the
chromosomal disorder. Record the chromosomal disorder in
Data Table 3.
Describe the genotype of each chromosomal disorder and record
in Data Table 3.
Describe the phenotype of each chromosomal disorder and record
in Data Table 3.
Data Table 3: Karyotype to Genotype to Phenotype
#
Chromosomal Disorder
Genotype
Phenotype
1
2
3
4
5
6
1 2 3 4 5 6 7 8 1 2 3 4 5 6 7...
 Suppose there are 100 identical firms in the market and the luggage industry is perfectly competitive. What does the market supply curve look like? 20 19 18 17 16 15 14 13 12 11 A 10 9 8 7 6 5 4 20 19 18 17 16 15 14 13 12 11 A 10 8 7 6 2 1 0 0 0 1 2 3 4 5 6 7 8 9 10 11 12 0 1 2 3 4 5...
 1. estimate a linear cost function
2. estimate a quadratic cost function
3. estimate a cubric cost function
1 A B с D 1 Cost data for a lumber mill 2 3 TC 4 11 5 32 2 6 93 3 7 248 4 8 575 5 9 1176 6 10 2177 7 11 3728 8 12 6003 9 13 9200 10 14 13541 11 15 19272 12 1626663 13 17 36008 14 18 47625 15 19 61856 16 20...
1. estimate a linear cost function
2. estimate a quadratic cost function
3. estimate a cubric cost function
1 A B с D 1 Cost data for a lumber mill 2 3 TC 4 11 5 32 2 6 93 3 7 248 4 8 575 5 9 1176 6 10 2177 7 11 3728 8 12 6003 9 13 9200 10 14 13541 11 15 19272 12 1626663 13 17 36008 14 18 47625 15 19 61856 16 20...
Most questions answered within 3 hours.
-
Where is the error in this code sequence?
String s1 = "Hello";
String s2 = "ello";...
asked 10 months ago -
Financial data for Joel de Paris, Inc., for last year
follow:
Joel de Paris, Inc.
Balance...
asked 10 months ago -
Consider this reaction:
Al2(SO4)3 (aq)+ BaCl3
(aq) Al2Cl6 (aq)- +
3BaSO4(s) . What is the...
asked 10 months ago -
Suppose that Savneet is considering increasing her
recent random sample from 20 car rentals to 40...
asked 10 months ago -
Trucks arrive at an unloading terminal at an average rate of 120
per hour.
Trucks arrive...
asked 10 months ago -
Why are methanol and ethanol completely soluble in water while
octanol is not very little soluble....
asked 10 months ago -
A facilities manager at a university reads in a research report
that the mean amount of...
asked 10 months ago -
When the CuSO4 is rehydrated by adding water to the anhydrous
compound, is this an endothermic...
asked 10 months ago -
A ray of sunlight is passing from diamond into crown glass; the
angle of incidence is...
asked 10 months ago -
A block of mass 0.249 kg is placed on top of a light, vertical
spring of...
asked 10 months ago -
how do the kidneys compensate in the presences of acidosis
a) trigger hyperventilate
b) reserve acid...
asked 10 months ago -
Question 501 pts
The rental rate of capital to the firm increases. Which of the
following...
asked 10 months ago