
Homework Answers
1)
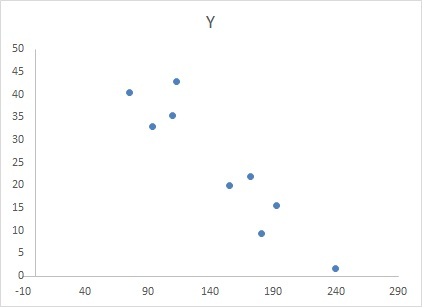
1. scatter-plot shows an approximate linear relationship.from above scatter-plot it seems they are negatively related
2)

3)

4)

Add Answer to:
Example An article in Wear presents data on the fretting wear of mild steel and oil...
Problem 1: (7 pointsl A study was performed on wear of a bearing Y and its relationship to XI - oil viscosity and X2 load. The following data were obtained. Use the Minitab output on the next pag...
 Problem 1: (7 pointsl A study was performed on wear of a bearing Y and its relationship to XI - oil viscosity and X2 load. The following data were obtained. Use the Minitab output on the next page to answer questions (a) to (e) XI 1.6 230 15.5 816 172 22.0 1058 293 91 113 125 43.0 1201 33.0 1357 40.0 1115 polnsl Find the regression equation that links the bearing Y to the oil viscosity and the load. )...
Q1 (30 points) Consider Problem 11.45, Page 637. Please note that for this problem the data...
 Q1 (30 points) Consider Problem 11.45, Page 637. Please note that for this problem the data will be entered in R as follows: #Enter data on x = Dose Level of Drug, and y = Potency of Drug (Problem 11.45, page 637) x<-c(2, 2, 2, 4, 4, 8, 8, 16, 16, 16, 32, 32, 64, 64, 64) y<-c(5, 7, 3, 10, 14, 15, 17, 20, 21, 19, 23, 29, 28, 31, 30) For this problem, answer the following questions. In...
We are interested in the relationship between the compensation of Chief Executive Officers (CEO) ...
We are interested in the relationship between the compensation of Chief Executive Officers (CEO) of firms and the return on equity of their respective firm, using the dataset below. The variable salary shows the annual salary of a CEO in thousands of dollars, so that y = 150 indicates a salary of $150,000. Similarly, the variable ROE represents the average return on equity (ROE)for the CEO’s firm for the previous three years. A ROE of 20 indicates an average return...
 Problem 1: (7 pointsl A study was performed on wear of a bearing Y and its relationship to XI - oil viscosity and X2 load. The following data were obtained. Use the Minitab output on the next page to answer questions (a) to (e) XI 1.6 230 15.5 816 172 22.0 1058 293 91 113 125 43.0 1201 33.0 1357 40.0 1115 polnsl Find the regression equation that links the bearing Y to the oil viscosity and the load. )...
 Q1 (30 points) Consider Problem 11.45, Page 637. Please note that for this problem the data will be entered in R as follows: #Enter data on x = Dose Level of Drug, and y = Potency of Drug (Problem 11.45, page 637) x<-c(2, 2, 2, 4, 4, 8, 8, 16, 16, 16, 32, 32, 64, 64, 64) y<-c(5, 7, 3, 10, 14, 15, 17, 20, 21, 19, 23, 29, 28, 31, 30) For this problem, answer the following questions. In...
Most questions answered within 3 hours.
-
Where is the error in this code sequence?
String s1 = "Hello";
String s2 = "ello";...
asked 10 months ago -
Financial data for Joel de Paris, Inc., for last year
follow:
Joel de Paris, Inc.
Balance...
asked 10 months ago -
Consider this reaction:
Al2(SO4)3 (aq)+ BaCl3
(aq) Al2Cl6 (aq)- +
3BaSO4(s) . What is the...
asked 10 months ago -
Suppose that Savneet is considering increasing her
recent random sample from 20 car rentals to 40...
asked 10 months ago -
Trucks arrive at an unloading terminal at an average rate of 120
per hour.
Trucks arrive...
asked 10 months ago -
Why are methanol and ethanol completely soluble in water while
octanol is not very little soluble....
asked 10 months ago -
A facilities manager at a university reads in a research report
that the mean amount of...
asked 10 months ago -
When the CuSO4 is rehydrated by adding water to the anhydrous
compound, is this an endothermic...
asked 10 months ago -
A ray of sunlight is passing from diamond into crown glass; the
angle of incidence is...
asked 10 months ago -
A block of mass 0.249 kg is placed on top of a light, vertical
spring of...
asked 10 months ago -
how do the kidneys compensate in the presences of acidosis
a) trigger hyperventilate
b) reserve acid...
asked 10 months ago -
Question 501 pts
The rental rate of capital to the firm increases. Which of the
following...
asked 10 months ago