
Homework Answers
Add Answer to:
.A Tirelling its product in two markets, A and B, the demand and marginal revenue functions...
The following shows the demands and marginal revenue in two markets (D1 and MR1, and D2...
 The following shows the demands and marginal revenue in two
markets (D1 and MR1, and D2 and MR2) for a price discriminating
firm along with total demand, DT, marginal revenue, MRT, and
marginal cost MC. As with the PPT slides, you can view the data
generating these lines; for reference,
D1=600–0.5Q
D2=800–0.5Q
MRT=700–0.5Q
DT=700–0.25Q
MC=0.0009Q2–0.5Q+376
The graph shows two sets of demand (D1,D2D1,D2) and marginal
revenue (MR1,MR2MR1,MR2) curves for individual markets 1 and 2,
with quantity on the horizontal axis,...
The following shows the demands and marginal revenue in two
markets (D1 and MR1, and D2 and MR2) for a price discriminating
firm along with total demand, DT, marginal revenue, MRT, and
marginal cost MC. As with the PPT slides, you can view the data
generating these lines; for reference,
D1=600–0.5Q
D2=800–0.5Q
MRT=700–0.5Q
DT=700–0.25Q
MC=0.0009Q2–0.5Q+376
The graph shows two sets of demand (D1,D2D1,D2) and marginal
revenue (MR1,MR2MR1,MR2) curves for individual markets 1 and 2,
with quantity on the horizontal axis,...
A firm sells its product in two different markets. The inverse demand in market A is...
A firm sells its product in two different markets. The inverse demand in market A is PA= 72 - 5QAand in market B, it is PB= 60 - 3QB. It has fixed costs of 72. Each unit it produces costs 12, i.e., marginal cost equals 12. To maximize profits, what quantities of output will be sold in each market and what will total profits be?(Show your work). ____________ ___________ _____________ in Market A in Market B total profits
A dry-cleaning business operates in a monopolistically competitive market with the following demand and marginal revenue...
A dry-cleaning business operates in a monopolistically competitive market with the following demand and marginal revenue curves: P = 100–5Q TR = 100Q–5Q2 MR = 100–10Q The business’s total and marginal cost curves are: TC = 4Q + Q2 + 5 MC = 4+2Q where P is in dollars per unit, output rate Q is in units per time period, and total cost C is in dollars. a) Determine the price and output rate that will allow the firm...
Hero Consider the graph of demand (D), average total cost (ATC), marginal revenue (MR), and marginal cost (MC) for...
 Hero Consider the graph of demand (D), average total cost (ATC), marginal revenue (MR), and marginal cost (MC) for a monopolistic firm. Assume no regulation is in place. Place box A on the graph to represent the profit or loss for the firm before regulation b. Now assume marginal cost pricing is imposed. Place box B on the graph to represent the profit or loss for the firm after marginal cost pricing is imposed. 678910111213141510 12 18 19 20 Market...
A firm is selling a single product in 2 markets (San Antonio and Houston). Demand schedules...
 A firm is selling a single product in 2 markets (San Antonio and
Houston). Demand schedules for the two markets are:
QSA = 140 – 2PSA or PSA = 70 -
.5 QSA
MRSA = 70 - QSA And QH = 40 -
.2PH or PH = 200 – 5QH and
MRH = 200 – 10QH
Total demand is: QSA + QH at equal prices,
P = 67.15 - .4286Q, and
Total cost of supplying customers is TC = $650...
A firm is selling a single product in 2 markets (San Antonio and
Houston). Demand schedules for the two markets are:
QSA = 140 – 2PSA or PSA = 70 -
.5 QSA
MRSA = 70 - QSA And QH = 40 -
.2PH or PH = 200 – 5QH and
MRH = 200 – 10QH
Total demand is: QSA + QH at equal prices,
P = 67.15 - .4286Q, and
Total cost of supplying customers is TC = $650...
QUESTION ONE A. Suppose the marginal cost and marginal revenue (in ¢000) for a product produced...
 QUESTION ONE A. Suppose the marginal cost and marginal revenue (in ¢000) for a product produced by a company is estimated to be MC = q +35 MR = 560 + 22q-q? Where q is the quantity produced and the firm's break-even is 5 units per week You are Required to 1. determine the total cost and the total revenue function in terms of q. (6 marks) II. estimate the output at which profit is maximize (6 marks) III. calculate...
Let us assume that there are two visitors, A and B, in an amusement park. The...
Let us assume that there are two visitors, A and B, in an amusement park. The demand curve for the visitors facing the amusement park are as follows. PA= 5 – 2QA PB= 2.5 – 0.5QB Marginal cost (MC) to serve each visitor is equal to $1. Solve for PA, PB, QA and QB assuming MR=MC. Calculate price elasticities of demand using Mark-up pricing formula. [Hint: use PA, PB and MC to solve for elasticities for visitor A (eA) and...
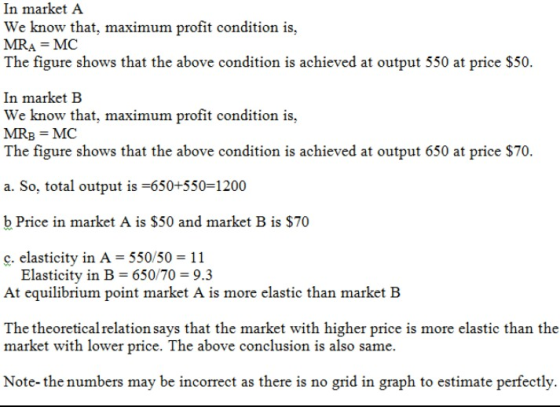
(Figure: Monopolist) Refer to the figure. Based on the demand curves for a monopolist's product in...
 (Figure: Monopolist) Refer to the figure. Based on the demand curves for a monopolist's product in two different markets—market A and market B—the price the monopolist should charge in market A to maximize profits is dollars while a price of dollars should be set in market B. Additionally, profit the monopolist earns by setting these prices in the segmented markets is dollars. Now assume arbitrage begins to become extensive within these two markets. The monopolist will then set one price...
The graph shows the demand (D), marginal cost (MC), marginal revenue (MR), and average variable cost (AVC) curves for a firm that is a price maker for its product.
 The graph shows the demand (D), marginal cost (MC), marginal revenue (MR), and average variable cost (AVC) curves for a firm that is a price maker for its product. The MC and AVC curves slope upward because one of the materials used to make the product is scarce. The firm can obtain a small supply cheaply, but additional units get more and more expensive. Additionally, the firm faces no fixed costs. If the firm is able to practice price discrimination, using...
 The following shows the demands and marginal revenue in two
markets (D1 and MR1, and D2 and MR2) for a price discriminating
firm along with total demand, DT, marginal revenue, MRT, and
marginal cost MC. As with the PPT slides, you can view the data
generating these lines; for reference,
D1=600–0.5Q
D2=800–0.5Q
MRT=700–0.5Q
DT=700–0.25Q
MC=0.0009Q2–0.5Q+376
The graph shows two sets of demand (D1,D2D1,D2) and marginal
revenue (MR1,MR2MR1,MR2) curves for individual markets 1 and 2,
with quantity on the horizontal axis,...
The following shows the demands and marginal revenue in two
markets (D1 and MR1, and D2 and MR2) for a price discriminating
firm along with total demand, DT, marginal revenue, MRT, and
marginal cost MC. As with the PPT slides, you can view the data
generating these lines; for reference,
D1=600–0.5Q
D2=800–0.5Q
MRT=700–0.5Q
DT=700–0.25Q
MC=0.0009Q2–0.5Q+376
The graph shows two sets of demand (D1,D2D1,D2) and marginal
revenue (MR1,MR2MR1,MR2) curves for individual markets 1 and 2,
with quantity on the horizontal axis,...
 Hero Consider the graph of demand (D), average total cost (ATC), marginal revenue (MR), and marginal cost (MC) for a monopolistic firm. Assume no regulation is in place. Place box A on the graph to represent the profit or loss for the firm before regulation b. Now assume marginal cost pricing is imposed. Place box B on the graph to represent the profit or loss for the firm after marginal cost pricing is imposed. 678910111213141510 12 18 19 20 Market...
 A firm is selling a single product in 2 markets (San Antonio and
Houston). Demand schedules for the two markets are:
QSA = 140 – 2PSA or PSA = 70 -
.5 QSA
MRSA = 70 - QSA And QH = 40 -
.2PH or PH = 200 – 5QH and
MRH = 200 – 10QH
Total demand is: QSA + QH at equal prices,
P = 67.15 - .4286Q, and
Total cost of supplying customers is TC = $650...
A firm is selling a single product in 2 markets (San Antonio and
Houston). Demand schedules for the two markets are:
QSA = 140 – 2PSA or PSA = 70 -
.5 QSA
MRSA = 70 - QSA And QH = 40 -
.2PH or PH = 200 – 5QH and
MRH = 200 – 10QH
Total demand is: QSA + QH at equal prices,
P = 67.15 - .4286Q, and
Total cost of supplying customers is TC = $650...
 QUESTION ONE A. Suppose the marginal cost and marginal revenue (in ¢000) for a product produced by a company is estimated to be MC = q +35 MR = 560 + 22q-q? Where q is the quantity produced and the firm's break-even is 5 units per week You are Required to 1. determine the total cost and the total revenue function in terms of q. (6 marks) II. estimate the output at which profit is maximize (6 marks) III. calculate...
 (Figure: Monopolist) Refer to the figure. Based on the demand curves for a monopolist's product in two different markets—market A and market B—the price the monopolist should charge in market A to maximize profits is dollars while a price of dollars should be set in market B. Additionally, profit the monopolist earns by setting these prices in the segmented markets is dollars. Now assume arbitrage begins to become extensive within these two markets. The monopolist will then set one price...
Most questions answered within 3 hours.
-
Where is the error in this code sequence?
String s1 = "Hello";
String s2 = "ello";...
asked 11 months ago -
Financial data for Joel de Paris, Inc., for last year
follow:
Joel de Paris, Inc.
Balance...
asked 11 months ago -
Consider this reaction:
Al2(SO4)3 (aq)+ BaCl3
(aq) Al2Cl6 (aq)- +
3BaSO4(s) . What is the...
asked 11 months ago -
Suppose that Savneet is considering increasing her
recent random sample from 20 car rentals to 40...
asked 11 months ago -
Trucks arrive at an unloading terminal at an average rate of 120
per hour.
Trucks arrive...
asked 11 months ago -
Why are methanol and ethanol completely soluble in water while
octanol is not very little soluble....
asked 11 months ago -
A facilities manager at a university reads in a research report
that the mean amount of...
asked 11 months ago -
When the CuSO4 is rehydrated by adding water to the anhydrous
compound, is this an endothermic...
asked 11 months ago -
A ray of sunlight is passing from diamond into crown glass; the
angle of incidence is...
asked 11 months ago -
A block of mass 0.249 kg is placed on top of a light, vertical
spring of...
asked 11 months ago -
how do the kidneys compensate in the presences of acidosis
a) trigger hyperventilate
b) reserve acid...
asked 11 months ago -
Question 501 pts
The rental rate of capital to the firm increases. Which of the
following...
asked 11 months ago