QUESTION 4 TABLE 2-5 The following are the duration in minutes of a sample of long-distance...
QUESTION 4
-
TABLE 2-5
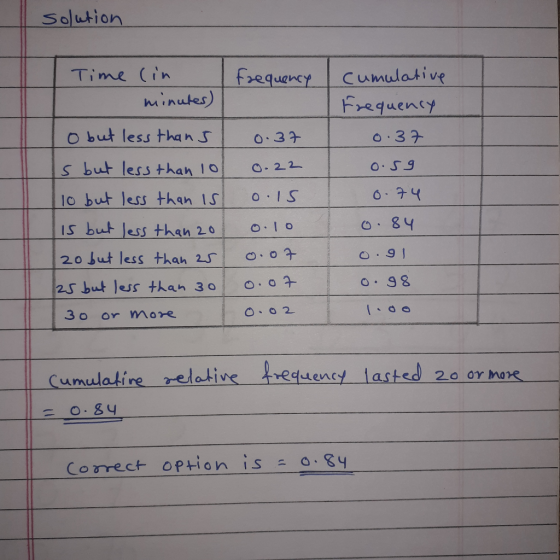
The following are the duration in minutes of a sample of long-distance phone calls made within the continental United States reported by one long-distance carrier.
Relative
Time (in Minutes) Frequency
0 but less than 5 0.37
5 but less than 10 0.22
10 but less than 15 0.15
15 but less than 20 0.10
20 but less than 25 0.07
25 but less than 30 0.07
30 or more 0.02
Referring to Table 2-5, what is the cumulative relative frequency for the percentage of calls that lasted 20 or more minutes?0.10
0.84
0.16
0.47
Homework Answers
Add Answer to:
QUESTION 4
TABLE 2-5
The following are the duration in minutes of a sample of
long-distance...
TABLE 2-5 The following are the duration in minutes of a sample of long-distance phone calls...
TABLE 2-5 The following are the duration in minutes of a sample of long-distance phone calls made within the continental United States reported by one long-distance carrier. Relative Time (in Minutes) Frequency 0 but less than 5 0.37 5 but less than 10 0.22 10 but less than 15 0.15 15 but less than 20 0.10 20 but less than 25 0.07 25 but less than 30 0.07 30 or more 0.02 Referring to Table 2-5, what is the cumulative...
The following are the duration in minutes of a sample of long-distance phone calls made within...
The following are the duration in minutes of a sample of long-distance phone calls made within the continental United States reported by one long-distance carrier. Time (In Minutes) Relative Frequency Cumulative Frequency 0 but less than 5 0.37 0.37 5 but less than 10 0.22 0.59 10 but less than 15 0.15 0.74 15 but less than 20 0.1 0.84 20 but less than 25 0.07 0.91 25 but less than 30 0.07 0.98 30 or more 0.02 1 Select...
1. The duration of 40 phone calls (in minutes) for technical support is given below 12...
 1. The duration of 40 phone calls (in minutes) for technical support is given below 12 3.3 0.5 48.7 16.7 1.2 14.8 8.2 9 5.7 11.5 17.7 3.2 20.8 7.3 8.0 0.2 51.2 3.3 5.2 12.3 24.5 13.3 7.7 13.5 4.3 13.7 10.7 18.8 15.7 3.2 28.7 16.2 23.3 9.7 4.7 6.5 0.5 45.1 5.3 Complete Table 3.5, the frequency distribution table for the call duration data Duration in Minutes 0-6 6-12 12-18 18-24 24-30 30-36 36-42 42-48 48-54 Frequency...
1. The duration of 40 phone calls (in minutes) for technical support is given belovw 12...
 1. The duration of 40 phone calls (in minutes) for technical support is given belovw 12 3.3 0.5 48.7 16.7 1.2 14.8 8.2 9 11.5 17.7 3. 20.8 7.3 8.0 0.2 51.2 3.3 5.2 12.3 24.5 13.3 7.713.5 4.3 13.7 10.7 18.8 15.7 3.2 28.7 16.2 23.3 9.74.7 6.5 0.5 45.1 5.3 5.7 Complete Table 3.5, the frequency distribution table for the call duration data Duration in Minutes Frequen Percent 6-12 12 18 18-24 24-30 30-36 36-42 42-48 48 -54...
pense QUESTION 1 A long distance phone company wishes to estimate the mean duration of long-distance...
 pense QUESTION 1 A long distance phone company wishes to estimate the mean duration of long-distance calls originating in California. A random sample of 15 long-distance calls originating in California yields the following call durations, in minutes 2 5 14 11 22 28 32 21 16 15 1 19 12 2 37 Use the data to obtain a point estimate of the mean call duration for all long-distance calls originating in California 15.3 minutes 13.8 minutes 15,8 minutes 13.9 minutes...
Consider the following table. Defects in batch Probability 2 0.21 3 0.37 4 0.22 5 0.10...
Consider the following table. Defects in batch Probability 2 0.21 3 0.37 4 0.22 5 0.10 6 0.07 7 0.03 Find the standard deviation of this variable which is one of these answers: 1.64 1.65 3.54 1.28
The following table gives the frequency distribution of the daily commuting times (in minutes) from home to work for a s...
The following table gives the frequency distribution of the daily commuting times (in minutes) from home to work for a sample of 25 employees of a company. Daily Commuting Time (mins) Number of Employees f Relative Frequency Cumulative Frequency Midpoint x xf (x - x̄)2 0 to less than 10 4 4/25 4 5 20 268.96 10 to less than 20 9 9/25 13 15 135 40.96 20 to less than 30 6 6/25 19 25 150 12.96 30 to...
A long distance carrier defines a late connection to be one that takes more than 5...
A long distance carrier defines a late connection to be one that takes more than 5 seconds to make. It randomly selects 850 phone calls each hour at a particular switching station during the peak hours of operation and determines how many of these calls are late. If it is known that the probability of a late connection is 0.0175 then find the probability that there are fewer than (less than) 13 late calls per hours? Use the Normal approximation...
Time 2 4 7 4 7 1 2 32 12 1 5 8 5 5 3...
 Time
2
4
7
4
7
1
2
32
12
1
5
8
5
5
3
4
26
18
4
13
Sorting through unsolicited e-mail and spam affects the productivity of office workers. An InsightExpress survey monitored office workers to determine the unproductive time per day devoted to unsolicited e-mail and spam (USA Today, November 13, 2003). The data in the Microsoft Excel Online file below show a sample of time in minutes devoted to this task. Summarize the data...
Time
2
4
7
4
7
1
2
32
12
1
5
8
5
5
3
4
26
18
4
13
Sorting through unsolicited e-mail and spam affects the productivity of office workers. An InsightExpress survey monitored office workers to determine the unproductive time per day devoted to unsolicited e-mail and spam (USA Today, November 13, 2003). The data in the Microsoft Excel Online file below show a sample of time in minutes devoted to this task. Summarize the data...
1. Fill in the missing values in the following table of relative frequency. I am stuck...
1. Fill in the missing values in the following table of relative frequency. I am stuck on this question since I was not given the sample size. If someone could help me that would be awesome! Class Frequency Relative Frequency Cumulative Relative Frequency 1 to 5 14 0.10 0.10 6 to 10 0.15 11 to 15 21 16 to 20 28 21 to 25 0.35 26 to 30 1.00
 1. The duration of 40 phone calls (in minutes) for technical support is given below 12 3.3 0.5 48.7 16.7 1.2 14.8 8.2 9 5.7 11.5 17.7 3.2 20.8 7.3 8.0 0.2 51.2 3.3 5.2 12.3 24.5 13.3 7.7 13.5 4.3 13.7 10.7 18.8 15.7 3.2 28.7 16.2 23.3 9.7 4.7 6.5 0.5 45.1 5.3 Complete Table 3.5, the frequency distribution table for the call duration data Duration in Minutes 0-6 6-12 12-18 18-24 24-30 30-36 36-42 42-48 48-54 Frequency...
 1. The duration of 40 phone calls (in minutes) for technical support is given belovw 12 3.3 0.5 48.7 16.7 1.2 14.8 8.2 9 11.5 17.7 3. 20.8 7.3 8.0 0.2 51.2 3.3 5.2 12.3 24.5 13.3 7.713.5 4.3 13.7 10.7 18.8 15.7 3.2 28.7 16.2 23.3 9.74.7 6.5 0.5 45.1 5.3 5.7 Complete Table 3.5, the frequency distribution table for the call duration data Duration in Minutes Frequen Percent 6-12 12 18 18-24 24-30 30-36 36-42 42-48 48 -54...
 pense QUESTION 1 A long distance phone company wishes to estimate the mean duration of long-distance calls originating in California. A random sample of 15 long-distance calls originating in California yields the following call durations, in minutes 2 5 14 11 22 28 32 21 16 15 1 19 12 2 37 Use the data to obtain a point estimate of the mean call duration for all long-distance calls originating in California 15.3 minutes 13.8 minutes 15,8 minutes 13.9 minutes...
 Time
2
4
7
4
7
1
2
32
12
1
5
8
5
5
3
4
26
18
4
13
Sorting through unsolicited e-mail and spam affects the productivity of office workers. An InsightExpress survey monitored office workers to determine the unproductive time per day devoted to unsolicited e-mail and spam (USA Today, November 13, 2003). The data in the Microsoft Excel Online file below show a sample of time in minutes devoted to this task. Summarize the data...
Time
2
4
7
4
7
1
2
32
12
1
5
8
5
5
3
4
26
18
4
13
Sorting through unsolicited e-mail and spam affects the productivity of office workers. An InsightExpress survey monitored office workers to determine the unproductive time per day devoted to unsolicited e-mail and spam (USA Today, November 13, 2003). The data in the Microsoft Excel Online file below show a sample of time in minutes devoted to this task. Summarize the data...
Most questions answered within 3 hours.
-
Where is the error in this code sequence?
String s1 = "Hello";
String s2 = "ello";...
asked 10 months ago -
Financial data for Joel de Paris, Inc., for last year
follow:
Joel de Paris, Inc.
Balance...
asked 10 months ago -
Consider this reaction:
Al2(SO4)3 (aq)+ BaCl3
(aq) Al2Cl6 (aq)- +
3BaSO4(s) . What is the...
asked 10 months ago -
Suppose that Savneet is considering increasing her
recent random sample from 20 car rentals to 40...
asked 10 months ago -
Trucks arrive at an unloading terminal at an average rate of 120
per hour.
Trucks arrive...
asked 10 months ago -
Why are methanol and ethanol completely soluble in water while
octanol is not very little soluble....
asked 10 months ago -
A facilities manager at a university reads in a research report
that the mean amount of...
asked 10 months ago -
When the CuSO4 is rehydrated by adding water to the anhydrous
compound, is this an endothermic...
asked 10 months ago -
A ray of sunlight is passing from diamond into crown glass; the
angle of incidence is...
asked 10 months ago -
A block of mass 0.249 kg is placed on top of a light, vertical
spring of...
asked 10 months ago -
how do the kidneys compensate in the presences of acidosis
a) trigger hyperventilate
b) reserve acid...
asked 10 months ago -
Question 501 pts
The rental rate of capital to the firm increases. Which of the
following...
asked 10 months ago