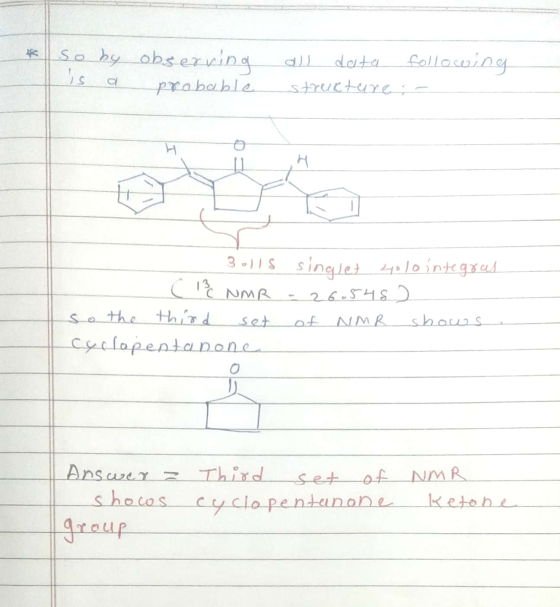
An aldol condensation reaction was performed where benzaldehyde
and cyclopentanone were used. The product is 2,5
dibenzylidenecyclopentanone or just 2-benzylidenecyclopentanone.
The spectra correspond with the aldehyde being benzaldehyde but the
ketone used could either be acetone, cyclopentanone or cyclohexane.
I need to find the NMR spectra that correspond to cyclopentanone
being the ketone in the aldol condensation. Which NMR spectra
correspond to the correct product?

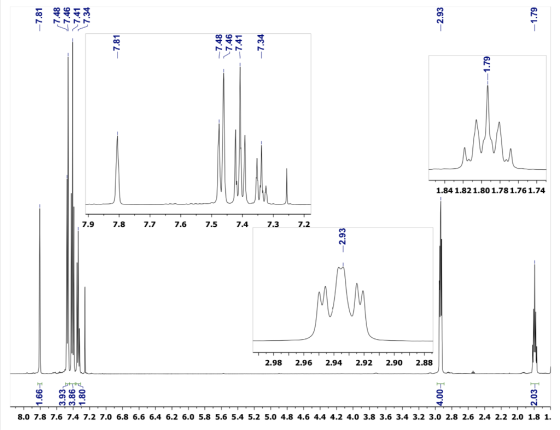


I think the second set is with cyclohexanone and not cyclopentanone but I could be wrong.
Homework Answers


Add Answer to:
An aldol condensation reaction was performed where benzaldehyde
and cyclopentanone were used. The product is 2,5...
Identify products peaks A-D in Diels-Alder reaction where we used Anthracene and Maleic anhydride to produce...
 Identify products peaks A-D in Diels-Alder reaction where we
used Anthracene and Maleic anhydride to produce Diels-Alder Product
7.41 7.40 7.26 odds 7.34 1-7.34 7.33 1.7.22 7.21 -7.21 17.20 17.20 17.18 6621 17.39 SE2 44.83 14.83 SRB 3.60 3.58 3.56 3.50 3.48 3.46 C (dd) 7.45 7.40 735 3.54 3.52 11 (ppm) 730 725 11 ppm) 720 7.15 7.10 B (da) A (dt) 7.397.20 E dd) 3.53 1.98 1,93 4.00 2.01 6.6 6.4 6.2 6.0 5.8 5.6 5.4 5.2 5.0...
Identify products peaks A-D in Diels-Alder reaction where we
used Anthracene and Maleic anhydride to produce Diels-Alder Product
7.41 7.40 7.26 odds 7.34 1-7.34 7.33 1.7.22 7.21 -7.21 17.20 17.20 17.18 6621 17.39 SE2 44.83 14.83 SRB 3.60 3.58 3.56 3.50 3.48 3.46 C (dd) 7.45 7.40 735 3.54 3.52 11 (ppm) 730 725 11 ppm) 720 7.15 7.10 B (da) A (dt) 7.397.20 E dd) 3.53 1.98 1,93 4.00 2.01 6.6 6.4 6.2 6.0 5.8 5.6 5.4 5.2 5.0...
Match the peaks labeled A,B,C,D,E to the Diels-Adler product and what part of the products structure...
 Match the peaks labeled A,B,C,D,E to the Diels-Adler
product and what part of the products structure creates each peak
on the NMR graph.
3.60 3.58 3.56 3.54 3.52 f1 (ppm) 3.50 3.48 3.46 C (dd) 7.34 7.45 7.40 7.35 7.30 7.25 i (ppm) 7,20 7.15 7.10 B (dd) A (dt) 7.39 7.20 D (t) 4.83 E (dd) 3.53 T T 1.98 1.93 4.00 2.09 2.01 .8 7.6 7.4 7.2 7.0 6.8 6.6 6.4 6.2 6.0 5.8 5.6 5.4 f1 (ppm)...
Match the peaks labeled A,B,C,D,E to the Diels-Adler
product and what part of the products structure creates each peak
on the NMR graph.
3.60 3.58 3.56 3.54 3.52 f1 (ppm) 3.50 3.48 3.46 C (dd) 7.34 7.45 7.40 7.35 7.30 7.25 i (ppm) 7,20 7.15 7.10 B (dd) A (dt) 7.39 7.20 D (t) 4.83 E (dd) 3.53 T T 1.98 1.93 4.00 2.09 2.01 .8 7.6 7.4 7.2 7.0 6.8 6.6 6.4 6.2 6.0 5.8 5.6 5.4 f1 (ppm)...
Parametirc test or not: Test statistic: p-value: decision: Is There A Difference Between the Means?
Parametirc test or not:Test statistic:p-value:decision:Is There A Difference Between the Means?6.7 6.2 3.1 310.3 10 5 5.56.9 5.5 3.3 3.110.5 6.3 4.3 5.44.5 4.6 1.8 25.6 5.6 2 2.65.9 6.1 2.1 2.58 11.7 4 4.68 7.4 3.3 3.15.8 5.2 3.1 2.96 7.3 3.0 3.28.7 5.3 2.7 36 5.5 2.1 2.27.2 6.3 3.5 3.25.9 4.6 2.9 3.46 7.4 3 3.37.2 7.8 3.7 3.48.6 9.4 5.1 5.77.2 8.1 2.8 3.15.8 5.4 2.2 1.83.3 4 1.7 1.86.8 5.1 2 1.83.7 3.5 2.2 2.112...
Analyze the proton and carbon NMR of toluene: PROTON_01 4632-1_Toluene 3.05 7.4 7.2 7.0 6.8 6.6...
 Analyze the proton and carbon NMR of
toluene:
PROTON_01 4632-1_Toluene 3.05 7.4 7.2 7.0 6.8 6.6 6.4 6.2 6.0 5.8 5.6 5.4 5.2 5.0 4.8 4.6 4.4 4.2 4.0 3.8 3.6 3.4 3.2 3.0 2.8 2.6 2.4 2.2 CARBON_01 4632-1_Toluene o nly in the human berkaitan dengan parte do plano niyo ba libog pompuan dalam till bra prowtwinpolvontado polownload to go to the worlogulowy o palpation and play a rapid plane ploha dhawa wala hawa nila bouwen 230 220 210...
Analyze the proton and carbon NMR of
toluene:
PROTON_01 4632-1_Toluene 3.05 7.4 7.2 7.0 6.8 6.6 6.4 6.2 6.0 5.8 5.6 5.4 5.2 5.0 4.8 4.6 4.4 4.2 4.0 3.8 3.6 3.4 3.2 3.0 2.8 2.6 2.4 2.2 CARBON_01 4632-1_Toluene o nly in the human berkaitan dengan parte do plano niyo ba libog pompuan dalam till bra prowtwinpolvontado polownload to go to the worlogulowy o palpation and play a rapid plane ploha dhawa wala hawa nila bouwen 230 220 210...
Label peaks and determine the structure of the aldehyde in the 1H NMR and 13C1H NMR:...
 Label peaks and determine the structure of the
aldehyde in the 1H NMR and 13C1H NMR:
pg 1H NMR of product from aldehyde Yin CDCI3 CHCI ppm Hz Intensity 17.73 3091.6 621.6 2 7.69 3075.7 690.3 3 7.59 3036.2 1108.5 4 7.57 3027.5 1199.0 5 6.98 2793.9 961.0 6 6.95 2779.9 1320.9 76.94 2778.0 1279.1 8 6.93 2771.1 1185.2 7.60 7.55 7.50 7.45 7.40 7.35 7.30 7.25 fl (ppm) 7.20 7.15 7.10 7.057.00 6.95 6.90 OK to group CHCl3 -...
Label peaks and determine the structure of the
aldehyde in the 1H NMR and 13C1H NMR:
pg 1H NMR of product from aldehyde Yin CDCI3 CHCI ppm Hz Intensity 17.73 3091.6 621.6 2 7.69 3075.7 690.3 3 7.59 3036.2 1108.5 4 7.57 3027.5 1199.0 5 6.98 2793.9 961.0 6 6.95 2779.9 1320.9 76.94 2778.0 1279.1 8 6.93 2771.1 1185.2 7.60 7.55 7.50 7.45 7.40 7.35 7.30 7.25 fl (ppm) 7.20 7.15 7.10 7.057.00 6.95 6.90 OK to group CHCl3 -...
Write down problem number. Provide formula, HDI value, and a complete, chemically correct structure for each...
 Write down problem number.
Provide formula, HDI value, and a complete, chemically correct
structure for each problem.
Assign signals in the 1H and 13C spectra to specific atoms,
identify structural units and/or functional groups.
Example:
Problem # 3
Formula: C8H8O2
HDI: 5
1H NMR: p-substituted Ar at 7.27-7.97 ppm, benzylic CH3 group at
2.42 ppm, COOH proton at 12.9 ppm
13C NMR: carbonyl C at 167.8 ppm (ester or acid), benzylic CH3
at 21.40 ppm, 4 remaining signals are Ar...
Write down problem number.
Provide formula, HDI value, and a complete, chemically correct
structure for each problem.
Assign signals in the 1H and 13C spectra to specific atoms,
identify structural units and/or functional groups.
Example:
Problem # 3
Formula: C8H8O2
HDI: 5
1H NMR: p-substituted Ar at 7.27-7.97 ppm, benzylic CH3 group at
2.42 ppm, COOH proton at 12.9 ppm
13C NMR: carbonyl C at 167.8 ppm (ester or acid), benzylic CH3
at 21.40 ppm, 4 remaining signals are Ar...
(a) From the spectral data ( H, C NMR, IR, MS) you were given, identify the...
 (a) From the spectral data ( H, C NMR, IR, MS) you were given,
identify the structure of your product. Explain why you chose your
particular product based on the spectroscopic data.
(b) Fully assign the 1H NMR spectrum of your product (i.e.
determine which peaks in the 1H NMR correspond to which hydrogens
in the product). You will not receive full marks for determination
of the unknown unless you assign the 1H NMR spectrum
completely.
(c) Now work backwards...
(a) From the spectral data ( H, C NMR, IR, MS) you were given,
identify the structure of your product. Explain why you chose your
particular product based on the spectroscopic data.
(b) Fully assign the 1H NMR spectrum of your product (i.e.
determine which peaks in the 1H NMR correspond to which hydrogens
in the product). You will not receive full marks for determination
of the unknown unless you assign the 1H NMR spectrum
completely.
(c) Now work backwards...
n the table below, earthquake magnitudes are given for any region for the last 100 years....
 n the table below, earthquake magnitudes are given for any
region for the last 100 years. Convert each value in this table to
your own values to get a new table.
your new values
A) frequency table and create histogram find
B)standard deviation, find values
C) ,%variation coefficients find values
D) mode and median find values
use the formula below for conversion
Mnew=M-log10(N)
N=33
please show which item you solved when solving
Sample (A B C D)
single digit after...
n the table below, earthquake magnitudes are given for any
region for the last 100 years. Convert each value in this table to
your own values to get a new table.
your new values
A) frequency table and create histogram find
B)standard deviation, find values
C) ,%variation coefficients find values
D) mode and median find values
use the formula below for conversion
Mnew=M-log10(N)
N=33
please show which item you solved when solving
Sample (A B C D)
single digit after...
The data on the below shows the number of hours a particular drug is in the...
The data on the below shows the number of hours a particular drug is in the system of 200 females. Develop a histogram of this data according to the following intervals: Follow the directions. Test the hypothesis that these data are distributed exponentially. Determine the test statistic. Round to two decimal places. (sort the data first) [0, 3) [3, 6) [6, 9) [9, 12) [12, 18) [18, 24) [24, infinity) 34.7 11.8 10 7.8 2.8 20 9.8 20.4 1.2 7.2...
Identify which one of the unknowns is represented in the data given Lab 8: Instrumental Analysis...
 Identify which one of the unknowns is represented in the data
given
Lab 8: Instrumental Analysis You are given seven unknowns, all of which are white or brown powders. Use the provided IR and 1H NMR spectra to assign Unknowns 1-7 to the given compounds. Label all spectra and briefly explain how you made your determinations. NH ОН OR foncommon - 0 o-vanillin Benzoic acid p-toluidine 4-tert-butylphenol OH Y OH H2NY COH salicylic acid 9-fluorenol 4-aminobenzoic acid F5500 15000 F4500...
Identify which one of the unknowns is represented in the data
given
Lab 8: Instrumental Analysis You are given seven unknowns, all of which are white or brown powders. Use the provided IR and 1H NMR spectra to assign Unknowns 1-7 to the given compounds. Label all spectra and briefly explain how you made your determinations. NH ОН OR foncommon - 0 o-vanillin Benzoic acid p-toluidine 4-tert-butylphenol OH Y OH H2NY COH salicylic acid 9-fluorenol 4-aminobenzoic acid F5500 15000 F4500...
 Identify products peaks A-D in Diels-Alder reaction where we
used Anthracene and Maleic anhydride to produce Diels-Alder Product
7.41 7.40 7.26 odds 7.34 1-7.34 7.33 1.7.22 7.21 -7.21 17.20 17.20 17.18 6621 17.39 SE2 44.83 14.83 SRB 3.60 3.58 3.56 3.50 3.48 3.46 C (dd) 7.45 7.40 735 3.54 3.52 11 (ppm) 730 725 11 ppm) 720 7.15 7.10 B (da) A (dt) 7.397.20 E dd) 3.53 1.98 1,93 4.00 2.01 6.6 6.4 6.2 6.0 5.8 5.6 5.4 5.2 5.0...
Identify products peaks A-D in Diels-Alder reaction where we
used Anthracene and Maleic anhydride to produce Diels-Alder Product
7.41 7.40 7.26 odds 7.34 1-7.34 7.33 1.7.22 7.21 -7.21 17.20 17.20 17.18 6621 17.39 SE2 44.83 14.83 SRB 3.60 3.58 3.56 3.50 3.48 3.46 C (dd) 7.45 7.40 735 3.54 3.52 11 (ppm) 730 725 11 ppm) 720 7.15 7.10 B (da) A (dt) 7.397.20 E dd) 3.53 1.98 1,93 4.00 2.01 6.6 6.4 6.2 6.0 5.8 5.6 5.4 5.2 5.0...
 Match the peaks labeled A,B,C,D,E to the Diels-Adler
product and what part of the products structure creates each peak
on the NMR graph.
3.60 3.58 3.56 3.54 3.52 f1 (ppm) 3.50 3.48 3.46 C (dd) 7.34 7.45 7.40 7.35 7.30 7.25 i (ppm) 7,20 7.15 7.10 B (dd) A (dt) 7.39 7.20 D (t) 4.83 E (dd) 3.53 T T 1.98 1.93 4.00 2.09 2.01 .8 7.6 7.4 7.2 7.0 6.8 6.6 6.4 6.2 6.0 5.8 5.6 5.4 f1 (ppm)...
Match the peaks labeled A,B,C,D,E to the Diels-Adler
product and what part of the products structure creates each peak
on the NMR graph.
3.60 3.58 3.56 3.54 3.52 f1 (ppm) 3.50 3.48 3.46 C (dd) 7.34 7.45 7.40 7.35 7.30 7.25 i (ppm) 7,20 7.15 7.10 B (dd) A (dt) 7.39 7.20 D (t) 4.83 E (dd) 3.53 T T 1.98 1.93 4.00 2.09 2.01 .8 7.6 7.4 7.2 7.0 6.8 6.6 6.4 6.2 6.0 5.8 5.6 5.4 f1 (ppm)...
 Analyze the proton and carbon NMR of
toluene:
PROTON_01 4632-1_Toluene 3.05 7.4 7.2 7.0 6.8 6.6 6.4 6.2 6.0 5.8 5.6 5.4 5.2 5.0 4.8 4.6 4.4 4.2 4.0 3.8 3.6 3.4 3.2 3.0 2.8 2.6 2.4 2.2 CARBON_01 4632-1_Toluene o nly in the human berkaitan dengan parte do plano niyo ba libog pompuan dalam till bra prowtwinpolvontado polownload to go to the worlogulowy o palpation and play a rapid plane ploha dhawa wala hawa nila bouwen 230 220 210...
Analyze the proton and carbon NMR of
toluene:
PROTON_01 4632-1_Toluene 3.05 7.4 7.2 7.0 6.8 6.6 6.4 6.2 6.0 5.8 5.6 5.4 5.2 5.0 4.8 4.6 4.4 4.2 4.0 3.8 3.6 3.4 3.2 3.0 2.8 2.6 2.4 2.2 CARBON_01 4632-1_Toluene o nly in the human berkaitan dengan parte do plano niyo ba libog pompuan dalam till bra prowtwinpolvontado polownload to go to the worlogulowy o palpation and play a rapid plane ploha dhawa wala hawa nila bouwen 230 220 210...
 Label peaks and determine the structure of the
aldehyde in the 1H NMR and 13C1H NMR:
pg 1H NMR of product from aldehyde Yin CDCI3 CHCI ppm Hz Intensity 17.73 3091.6 621.6 2 7.69 3075.7 690.3 3 7.59 3036.2 1108.5 4 7.57 3027.5 1199.0 5 6.98 2793.9 961.0 6 6.95 2779.9 1320.9 76.94 2778.0 1279.1 8 6.93 2771.1 1185.2 7.60 7.55 7.50 7.45 7.40 7.35 7.30 7.25 fl (ppm) 7.20 7.15 7.10 7.057.00 6.95 6.90 OK to group CHCl3 -...
Label peaks and determine the structure of the
aldehyde in the 1H NMR and 13C1H NMR:
pg 1H NMR of product from aldehyde Yin CDCI3 CHCI ppm Hz Intensity 17.73 3091.6 621.6 2 7.69 3075.7 690.3 3 7.59 3036.2 1108.5 4 7.57 3027.5 1199.0 5 6.98 2793.9 961.0 6 6.95 2779.9 1320.9 76.94 2778.0 1279.1 8 6.93 2771.1 1185.2 7.60 7.55 7.50 7.45 7.40 7.35 7.30 7.25 fl (ppm) 7.20 7.15 7.10 7.057.00 6.95 6.90 OK to group CHCl3 -...
 Write down problem number.
Provide formula, HDI value, and a complete, chemically correct
structure for each problem.
Assign signals in the 1H and 13C spectra to specific atoms,
identify structural units and/or functional groups.
Example:
Problem # 3
Formula: C8H8O2
HDI: 5
1H NMR: p-substituted Ar at 7.27-7.97 ppm, benzylic CH3 group at
2.42 ppm, COOH proton at 12.9 ppm
13C NMR: carbonyl C at 167.8 ppm (ester or acid), benzylic CH3
at 21.40 ppm, 4 remaining signals are Ar...
Write down problem number.
Provide formula, HDI value, and a complete, chemically correct
structure for each problem.
Assign signals in the 1H and 13C spectra to specific atoms,
identify structural units and/or functional groups.
Example:
Problem # 3
Formula: C8H8O2
HDI: 5
1H NMR: p-substituted Ar at 7.27-7.97 ppm, benzylic CH3 group at
2.42 ppm, COOH proton at 12.9 ppm
13C NMR: carbonyl C at 167.8 ppm (ester or acid), benzylic CH3
at 21.40 ppm, 4 remaining signals are Ar...
 (a) From the spectral data ( H, C NMR, IR, MS) you were given,
identify the structure of your product. Explain why you chose your
particular product based on the spectroscopic data.
(b) Fully assign the 1H NMR spectrum of your product (i.e.
determine which peaks in the 1H NMR correspond to which hydrogens
in the product). You will not receive full marks for determination
of the unknown unless you assign the 1H NMR spectrum
completely.
(c) Now work backwards...
(a) From the spectral data ( H, C NMR, IR, MS) you were given,
identify the structure of your product. Explain why you chose your
particular product based on the spectroscopic data.
(b) Fully assign the 1H NMR spectrum of your product (i.e.
determine which peaks in the 1H NMR correspond to which hydrogens
in the product). You will not receive full marks for determination
of the unknown unless you assign the 1H NMR spectrum
completely.
(c) Now work backwards...
 n the table below, earthquake magnitudes are given for any
region for the last 100 years. Convert each value in this table to
your own values to get a new table.
your new values
A) frequency table and create histogram find
B)standard deviation, find values
C) ,%variation coefficients find values
D) mode and median find values
use the formula below for conversion
Mnew=M-log10(N)
N=33
please show which item you solved when solving
Sample (A B C D)
single digit after...
n the table below, earthquake magnitudes are given for any
region for the last 100 years. Convert each value in this table to
your own values to get a new table.
your new values
A) frequency table and create histogram find
B)standard deviation, find values
C) ,%variation coefficients find values
D) mode and median find values
use the formula below for conversion
Mnew=M-log10(N)
N=33
please show which item you solved when solving
Sample (A B C D)
single digit after...
 Identify which one of the unknowns is represented in the data
given
Lab 8: Instrumental Analysis You are given seven unknowns, all of which are white or brown powders. Use the provided IR and 1H NMR spectra to assign Unknowns 1-7 to the given compounds. Label all spectra and briefly explain how you made your determinations. NH ОН OR foncommon - 0 o-vanillin Benzoic acid p-toluidine 4-tert-butylphenol OH Y OH H2NY COH salicylic acid 9-fluorenol 4-aminobenzoic acid F5500 15000 F4500...
Identify which one of the unknowns is represented in the data
given
Lab 8: Instrumental Analysis You are given seven unknowns, all of which are white or brown powders. Use the provided IR and 1H NMR spectra to assign Unknowns 1-7 to the given compounds. Label all spectra and briefly explain how you made your determinations. NH ОН OR foncommon - 0 o-vanillin Benzoic acid p-toluidine 4-tert-butylphenol OH Y OH H2NY COH salicylic acid 9-fluorenol 4-aminobenzoic acid F5500 15000 F4500...
Most questions answered within 3 hours.
-
Where is the error in this code sequence?
String s1 = "Hello";
String s2 = "ello";...
asked 10 months ago -
Financial data for Joel de Paris, Inc., for last year
follow:
Joel de Paris, Inc.
Balance...
asked 10 months ago -
Consider this reaction:
Al2(SO4)3 (aq)+ BaCl3
(aq) Al2Cl6 (aq)- +
3BaSO4(s) . What is the...
asked 10 months ago -
Suppose that Savneet is considering increasing her
recent random sample from 20 car rentals to 40...
asked 10 months ago -
Trucks arrive at an unloading terminal at an average rate of 120
per hour.
Trucks arrive...
asked 10 months ago -
Why are methanol and ethanol completely soluble in water while
octanol is not very little soluble....
asked 10 months ago -
A facilities manager at a university reads in a research report
that the mean amount of...
asked 10 months ago -
When the CuSO4 is rehydrated by adding water to the anhydrous
compound, is this an endothermic...
asked 10 months ago -
A ray of sunlight is passing from diamond into crown glass; the
angle of incidence is...
asked 10 months ago -
A block of mass 0.249 kg is placed on top of a light, vertical
spring of...
asked 10 months ago -
how do the kidneys compensate in the presences of acidosis
a) trigger hyperventilate
b) reserve acid...
asked 10 months ago -
Question 501 pts
The rental rate of capital to the firm increases. Which of the
following...
asked 10 months ago