
Homework Answers

Add Answer to:
A random sample of 10 houses in Big Rapids, each of which is heated with natural...
(a) A random sample of 10 houses in a particular area, each of which is heated...
 (a) A random sample of 10 houses in a particular area, each of which is heated with natural gas, is selected and the amount of gas (therms) used during the month of January is determined for each house. The resulting observations are 122, 125, 144, 109, 99, 118, 103, 145, 88, 138. Let u denote the average gas usage during January by all houses in this area. Compute a point estimate of u. therms (b) Suppose there are 23,000 houses...
A random sample of 10 houses heated with natural gas in a particular area is selected,...
A random sample of 10 houses heated with natural gas in a particular area is selected, and the amount of gas (in therms) used during the month of January is determined for each house. The resulting observations are as follows. 140 148 112 101 130 79 117 91 96 110 (a) Let μJ denote the average gas usage during January by all houses in this area. Calculate a point estimate of μJ. therms (b) Suppose that 10,000 houses in this area use natural gas for heating. Let τ denote...
ta) A random sample ot 10 houses in a particular area, each of which is heated...
 ta) A random sample ot 10 houses in a particular area, each of which is heated with natural gas, s selected and the amount of gas (therms) used during the month of lanuary is determined tor each house. The resuing observations are 103, 138, 109, 122, 125, 148, iso, su, 9, 118. Let ? denote the average gas usage during January by all houses in this area. Compute a port estimate of c. therms o Bao o ) suppose there...
A random sample of 10 houses in a particular area, each of which is heated with...
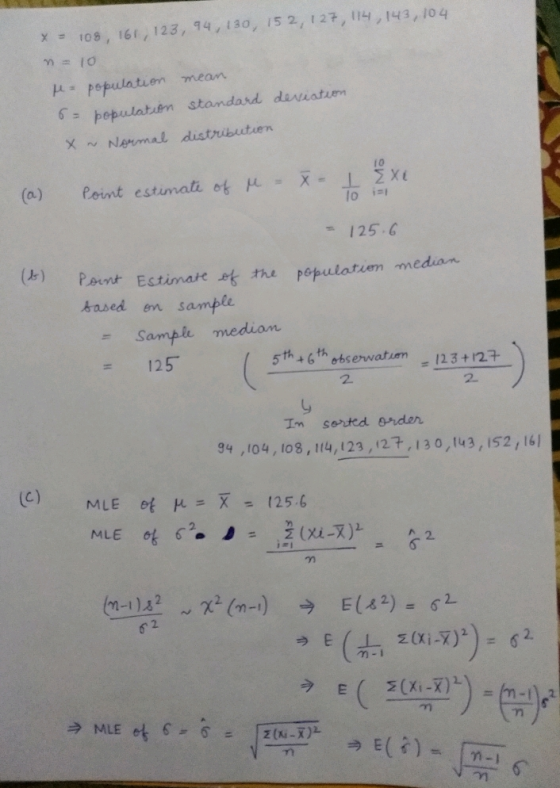
A random sample of 10 houses in a particular area, each of which is heated with natural gas, is selected and the amount of gas (therms) used during the month of January is determined for each house. The resulting observations are 103, 156, 118, 89, 125, 147, 122, 109, 138, 99. Let mu denote the average gas usage during January by all houses in this area. a) Compute a point estimate of μ b) Find a 95% Confidence Interval of...
A random sample of n = 10 regions in New England gave the following violent crime...
 A random sample of n = 10 regions in New England gave the following violent crime rates (per million population). x New England Crime Rate 3.3 3.7 4.2 3.9 3.3 4.1 1.8 4.8 2.9 3.1 Another random sample of n = 12 regions in the Rocky Mountain states gave the following violent crime rates (per million population). x, Rocky Mountain Crime Rate 3.7 4.1 4.7 5.1 3.3 4.8 3.5 2.4 3.1 3.5 5.2 2.8 Assume that the crime rate distribution...
Organization: Freestanding ER Services Title: ER Operations Manager Outline: Multiple Regression: Effect of Age and General Health Status Score on Total ER Cost. Purpose Importance Variables Sample...
Organization: Freestanding ER Services Title: ER Operations Manager Outline: Multiple Regression: Effect of Age and General Health Status Score on Total ER Cost. Purpose Importance Variables Sample Size Hypothesis Methodology Findings Interpretations/Implications Description of each Section Purpose: Identify the purpose of the analysis in this section. What questions do you hope to answer? Importance: State and explain the importance of this analysis to the department/organization. How will the findings be used? Variables: List all variables, explain how they will be...
HELP needed urgently....Data and question is attacted below..... Thank you in advance there is no data...
 HELP needed urgently....Data and question is attacted below.....
Thank you in advance
there is no data link fir this data it’s all in photos.... thank
you
i
have already posted the question
We were unable to transcribe this imageNo. 2 3 4 5 6 7 8 Working Sector Public Own Public Public Private Public Private Private Own Own Private Public Public Public Private 9 10 11 12 13 Public IS 16 17 18 19 20 21 22 23 24 25...
HELP needed urgently....Data and question is attacted below.....
Thank you in advance
there is no data link fir this data it’s all in photos.... thank
you
i
have already posted the question
We were unable to transcribe this imageNo. 2 3 4 5 6 7 8 Working Sector Public Own Public Public Private Public Private Private Own Own Private Public Public Public Private 9 10 11 12 13 Public IS 16 17 18 19 20 21 22 23 24 25...
 (a) A random sample of 10 houses in a particular area, each of which is heated with natural gas, is selected and the amount of gas (therms) used during the month of January is determined for each house. The resulting observations are 122, 125, 144, 109, 99, 118, 103, 145, 88, 138. Let u denote the average gas usage during January by all houses in this area. Compute a point estimate of u. therms (b) Suppose there are 23,000 houses...
 ta) A random sample ot 10 houses in a particular area, each of which is heated with natural gas, s selected and the amount of gas (therms) used during the month of lanuary is determined tor each house. The resuing observations are 103, 138, 109, 122, 125, 148, iso, su, 9, 118. Let ? denote the average gas usage during January by all houses in this area. Compute a port estimate of c. therms o Bao o ) suppose there...
 A random sample of n = 10 regions in New England gave the following violent crime rates (per million population). x New England Crime Rate 3.3 3.7 4.2 3.9 3.3 4.1 1.8 4.8 2.9 3.1 Another random sample of n = 12 regions in the Rocky Mountain states gave the following violent crime rates (per million population). x, Rocky Mountain Crime Rate 3.7 4.1 4.7 5.1 3.3 4.8 3.5 2.4 3.1 3.5 5.2 2.8 Assume that the crime rate distribution...
 HELP needed urgently....Data and question is attacted below.....
Thank you in advance
there is no data link fir this data it’s all in photos.... thank
you
i
have already posted the question
We were unable to transcribe this imageNo. 2 3 4 5 6 7 8 Working Sector Public Own Public Public Private Public Private Private Own Own Private Public Public Public Private 9 10 11 12 13 Public IS 16 17 18 19 20 21 22 23 24 25...
HELP needed urgently....Data and question is attacted below.....
Thank you in advance
there is no data link fir this data it’s all in photos.... thank
you
i
have already posted the question
We were unable to transcribe this imageNo. 2 3 4 5 6 7 8 Working Sector Public Own Public Public Private Public Private Private Own Own Private Public Public Public Private 9 10 11 12 13 Public IS 16 17 18 19 20 21 22 23 24 25...
Most questions answered within 3 hours.
-
Where is the error in this code sequence?
String s1 = "Hello";
String s2 = "ello";...
asked 10 months ago -
Financial data for Joel de Paris, Inc., for last year
follow:
Joel de Paris, Inc.
Balance...
asked 10 months ago -
Consider this reaction:
Al2(SO4)3 (aq)+ BaCl3
(aq) Al2Cl6 (aq)- +
3BaSO4(s) . What is the...
asked 10 months ago -
Suppose that Savneet is considering increasing her
recent random sample from 20 car rentals to 40...
asked 10 months ago -
Trucks arrive at an unloading terminal at an average rate of 120
per hour.
Trucks arrive...
asked 10 months ago -
Why are methanol and ethanol completely soluble in water while
octanol is not very little soluble....
asked 10 months ago -
A facilities manager at a university reads in a research report
that the mean amount of...
asked 10 months ago -
When the CuSO4 is rehydrated by adding water to the anhydrous
compound, is this an endothermic...
asked 10 months ago -
A ray of sunlight is passing from diamond into crown glass; the
angle of incidence is...
asked 10 months ago -
A block of mass 0.249 kg is placed on top of a light, vertical
spring of...
asked 10 months ago -
how do the kidneys compensate in the presences of acidosis
a) trigger hyperventilate
b) reserve acid...
asked 10 months ago -
Question 501 pts
The rental rate of capital to the firm increases. Which of the
following...
asked 10 months ago