
Homework Answers

Add Answer to:
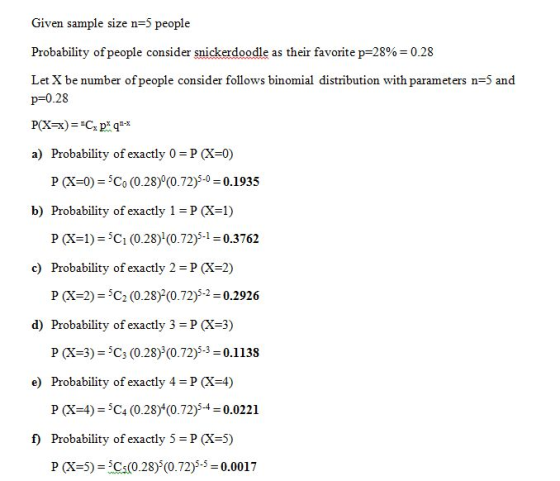
12. In the US, 28% of people consider snickerdoodle as their favorite cookie. You asked 5...
W e will not be enough college graduates? 23) Favorite Cookie e Hilly two percent of...
 W e will not be enough college graduates? 23) Favorite Cookie e Hilly two percent of adults say chocolate chip is their Fifty-two percent of adults say Orte. You randomly select 40 adults and ask each if chocolate chip is his or her favorite cookie. (Source: Wearever) Find the probability that at most 23 people say chocolate chip is the favorite cookie. (h) Find the
A random selection of US adults are asked their age and their favorite dessert. The results...
 A random selection of US adults are asked their age and their favorite dessert. The results of the survey are given in the following table. Use this information to answer the following questions. In the place provided, write the proper probability statements and give answers as fractions or decimals, rounded to two decimal places. Cake Brownies Pie Ice Cream Cookies Other Total 18 - 22 13 22 9 11 19 2 76 23 - 28 18 14 21 15 7...
A group of people was asked "What is your favorite soda?" The results are given in...
A group of people was asked "What is your favorite soda?" The results are given in the table below. Coke Pepsi Dr. Pepper 7-Up Mountain Dew Other Total Male 165 138 95 47 73 124 642 Female 192 103 98 69 36 169 667 Total 357 241 193 116 109 293 1309 1. If person is selected at random from this group, what is the probability that the person is male given the person's favorite soda is Mountain Dew? 2....
12. Let the number of Chocolate chips in a oatmeal cookie have a Poisson distribution. We...
 12. Let the number of Chocolate chips in a oatmeal cookie have a Poisson distribution. We want the probability that a cookie of this type contains at least three chocolate chips to be greater than 0.98. Find the smallest value of the mean that the distribution can take. (You may need a graphing calculator)
3.) Twelve percent of people in the US eligible to donate blood actually do. You randomly...
 3.) Twelve percent of people in the US eligible to donate blood actually do. You randomly section 15 eligible blood donors and ask them if they donate blood. a. Construct a binomial distribution (table) i. First column x values ii. Second column boundaries iii. Third column probabilities using Excel functions b. Create a histogram of this probability distribution. c. Describe the histogram. d. Find the mean of the probability distribution by creating a fourth column multiplying the x value and...
Question 1 You have been asked to consider a random variable X that has 4 possible...
Question 1 You have been asked to consider a random variable X that has 4 possible outcomes. Those outcomes are X ={1,2,3,4}. Modify H3_Q1.java to accomplish the following tasks. a. package studentWork; import java.util.Scanner; public class H3_Q1 { public static void main(String[] args) { Scanner scnr = new Scanner(System.in); //variables storing 4 outcomes entered by user double outcome1; double outcome2; double outcome3; double outcome4; Addcodethatpromptstheuserfortheprobabilityassociatedwitheachofthe4outcomes(e.g. P(X = x)) and reads the values into the variables provided. b. Determine whether each...
In a recent study, 30% of people surveyed indicate chocolate was their favorite flavor of ice...
In a recent study, 30% of people surveyed indicate chocolate was their favorite flavor of ice cream. Suppose we select a sample of 9 people and ask them to name their favorite flavor of ice cream. How many of those in the sample would you expect to name chocolate? (Round your answer to 1 decimal place.) What is the probability exactly three of those in the sample name chocolate? (Round the probability to 5 decimal places and the final answer...
1. You have conducted a study asking 20 people what their favorite flavor of ice cream...
1. You have conducted a study asking 20 people what their favorite flavor of ice cream is. Using the following data set, create a: a. Frequency table, including simple frequency, relative frequency, and cumulative frequency b. Bar Chart or Histogram (Whichever is appropriate) Data: Chocolate, Vanilla, Vanilla, Mint Chocolate Chip, Butterscotch, Vanilla, Strawberry, Vanilla, Butterscotch, Chocolate, Neapolitan, Strawberry, Strawberry, Neapolitan, Mint Chocolate Chip, Strawberry, Butterscotch, Mint Chocolate Chip, Vanilla, Chocolate 2. The following is a set of scores from a...
7) During the Coronavirus lockdown, 115 people were asked about their favorite games and snacks. The...
 7) During the Coronavirus lockdown, 115 people were asked about their favorite games and snacks. The table below shows the results of the survey. Use proper probability notation throughout the problems. The events are defined below. Pizza Rolls Chips and Dip Cookies Totals Events Poker 10 1225 PR = likes to eat Pizza Rolls CD = likes to eat Chips and Dip Trivial Pursuit 8 C = likes to eat Cookies Monopoly = likes to play Poker = likes to...
16. Among respondents asked which is their favorite seat on a plane, 493 chose the window...
16. Among respondents asked which is their favorite seat on a plane, 493 chose the window seat, 10 chose the middle seat, and 302 chose the aisle seat. What is the probability that a passenger prefers the middle seat? Is it unlikely for a passenger to prefer the middle seat? If so, why is the middle seat so unpopular? The probability that a passenger prefers the middle seat is (Round to three decimal places as needed.) 17. To the right...
 W e will not be enough college graduates? 23) Favorite Cookie e Hilly two percent of adults say chocolate chip is their Fifty-two percent of adults say Orte. You randomly select 40 adults and ask each if chocolate chip is his or her favorite cookie. (Source: Wearever) Find the probability that at most 23 people say chocolate chip is the favorite cookie. (h) Find the
 A random selection of US adults are asked their age and their favorite dessert. The results of the survey are given in the following table. Use this information to answer the following questions. In the place provided, write the proper probability statements and give answers as fractions or decimals, rounded to two decimal places. Cake Brownies Pie Ice Cream Cookies Other Total 18 - 22 13 22 9 11 19 2 76 23 - 28 18 14 21 15 7...
 12. Let the number of Chocolate chips in a oatmeal cookie have a Poisson distribution. We want the probability that a cookie of this type contains at least three chocolate chips to be greater than 0.98. Find the smallest value of the mean that the distribution can take. (You may need a graphing calculator)
 3.) Twelve percent of people in the US eligible to donate blood actually do. You randomly section 15 eligible blood donors and ask them if they donate blood. a. Construct a binomial distribution (table) i. First column x values ii. Second column boundaries iii. Third column probabilities using Excel functions b. Create a histogram of this probability distribution. c. Describe the histogram. d. Find the mean of the probability distribution by creating a fourth column multiplying the x value and...
 7) During the Coronavirus lockdown, 115 people were asked about their favorite games and snacks. The table below shows the results of the survey. Use proper probability notation throughout the problems. The events are defined below. Pizza Rolls Chips and Dip Cookies Totals Events Poker 10 1225 PR = likes to eat Pizza Rolls CD = likes to eat Chips and Dip Trivial Pursuit 8 C = likes to eat Cookies Monopoly = likes to play Poker = likes to...
Most questions answered within 3 hours.
-
Where is the error in this code sequence?
String s1 = "Hello";
String s2 = "ello";...
asked 11 months ago -
Financial data for Joel de Paris, Inc., for last year
follow:
Joel de Paris, Inc.
Balance...
asked 11 months ago -
Consider this reaction:
Al2(SO4)3 (aq)+ BaCl3
(aq) Al2Cl6 (aq)- +
3BaSO4(s) . What is the...
asked 11 months ago -
Suppose that Savneet is considering increasing her
recent random sample from 20 car rentals to 40...
asked 11 months ago -
Trucks arrive at an unloading terminal at an average rate of 120
per hour.
Trucks arrive...
asked 11 months ago -
Why are methanol and ethanol completely soluble in water while
octanol is not very little soluble....
asked 11 months ago -
A facilities manager at a university reads in a research report
that the mean amount of...
asked 11 months ago -
When the CuSO4 is rehydrated by adding water to the anhydrous
compound, is this an endothermic...
asked 11 months ago -
A ray of sunlight is passing from diamond into crown glass; the
angle of incidence is...
asked 11 months ago -
A block of mass 0.249 kg is placed on top of a light, vertical
spring of...
asked 11 months ago -
how do the kidneys compensate in the presences of acidosis
a) trigger hyperventilate
b) reserve acid...
asked 11 months ago -
Question 501 pts
The rental rate of capital to the firm increases. Which of the
following...
asked 11 months ago