
Homework Answers
| X | Y | XY | X² | Y² |
| 6 | 15 | 90 | 36 | 225 |
| 20 | 31 | 620 | 400 | 961 |
| 0 | 10 | 0 | 0 | 100 |
| 14 | 16 | 224 | 196 | 256 |
| 25 | 28 | 700 | 625 | 784 |
| 16 | 20 | 320 | 256 | 400 |
| 28 | 40 | 1120 | 784 | 1600 |
| 18 | 25 | 450 | 324 | 625 |
| 10 | 12 | 120 | 100 | 144 |
| 8 | 15 | 120 | 64 | 225 |
| Ʃx = | Ʃy = | Ʃxy = | Ʃx² = | Ʃy² = |
| 145 | 212 | 3764 | 2785 | 5320 |
| Sample size, n = | 10 |
| x̅ = Ʃx/n = 145/10 = | 14.5 |
| y̅ = Ʃy/n = 212/10 = | 21.2 |
| SSxx = Ʃx² - (Ʃx)²/n = 2785 - (145)²/10 = | 682.5 |
| SSyy = Ʃy² - (Ʃy)²/n = 5320 - (212)²/10 = | 825.6 |
| SSxy = Ʃxy - (Ʃx)(Ʃy)/n = 3764 - (145)(212)/10 = | 690 |
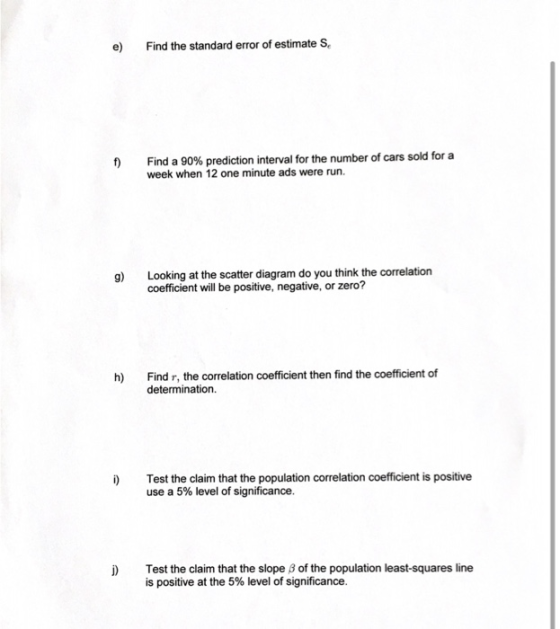
e)
Sum of Square error, SSE = SSyy -SSxy²/SSxx = 825.6 - (690)²/682.5 = 128.0175824
Standard error, se = √(SSE/(n-2)) = √(128.01758/(10-2)) = 4.00027
f)
Slope, b = SSxy/SSxx = 690/682.5 = 1.010989
y-intercept, a = y̅ -b* x̅ = 21.2 - (1.01099)*14.5 = 6.540659
Regression equation :
ŷ = 6.5407 + (1.011) x
Predicted value of y at x = 12
ŷ = 6.5407 + (1.011) * 12 = 18.6725
Critical value, t_c = T.INV.2T(0.1, 8) = 1.8595
90% Prediction interval :
Lower limit = ŷ - tc*se*√(1 + (1/n) + ((x-x̅)²/(SSxx)))
= 18.6725 - 1.8595*4.0003*√(1 + (1/10) + ((12 - 14.5)²/(682.5))) = 10.8383
Upper limit = ŷ + tc*se*√(1 + (1/n) + ((x-x̅)²/(SSxx)))
= 18.6725 + 1.8595*4.0003*√(1 + (1/10) + ((12 - 14.5)²/(682.5))) = 26.5067
j)
Null and alternative hypothesis:
Ho: β₁ = 0
Ha: β₁ > 0
Test statistic:
t = b/(se/√SSxx) = 6.6025
df = n-2 = 8
p-value = T.DIST.2T(ABS(6.6025), 8) = 0.0001
Conclusion:
p-value < α, Reject the null hypothesis.
Add Answer to:
I
only need help with E, F and J please!
Statistics Assignment 15 1. A local...
Question 47 (20 points) A local tire dealer wants to predict the number of tires sold...
 Question 47 (20 points) A local tire dealer wants to predict the number of tires sold each month. He believes that the number of tires sold is a linear function of the amount of money invested in advertising. He randomly selects 6 months of data consisting of tire sales (in thousands of tires) and advertising expenditures (in thousands of dollars). Based on the data set with 6 observations, the simple linear regression model yielded the following results. X = 24...
1) (15%) For Applied Management Statistics class you want to know how college students feel about...
 1) (15%) For Applied Management Statistics class you want to know how college students feel about the transportation system in Barcelona. a) What is the population in this study? b) What type of sample would you use and why? 2) (25%) A manager of an e-commerce company would like to determine average delivery time of the products. A sample of 25 customers is taken. The average delivery time in the sample was four days. Suppose the delivery times are normally...
Use only the Excel functions (no calculator). I need to see all Excel formulas to give...
 Use only the Excel functions (no calculator). I need to see all
Excel formulas to give you a full credit. Give answers to the 4th
decimal place.
1. (Sheet #1) (10 points) Use the following categorical
frequency distribution to answer each problem. a. (4 pts) Create a
pie chart and pareto chart. b. (3 pts) Add two more columns:
Relative Frequency (rf) and Cumulative Relative Frequency (crf).
Calculate rf and crf. c. (1 pt.) Find a mean. d. (1 pt.)...
Use only the Excel functions (no calculator). I need to see all
Excel formulas to give you a full credit. Give answers to the 4th
decimal place.
1. (Sheet #1) (10 points) Use the following categorical
frequency distribution to answer each problem. a. (4 pts) Create a
pie chart and pareto chart. b. (3 pts) Add two more columns:
Relative Frequency (rf) and Cumulative Relative Frequency (crf).
Calculate rf and crf. c. (1 pt.) Find a mean. d. (1 pt.)...
The table below lists the numbers of audience impressions (in hundreds of millions) listening t...
The table below lists the numbers of audience impressions (in hundreds of millions) listening to songs and the corresponding numbers of albums sold (in hundreds of thousands). Does it appear that album sales are affected very strongly by the number of audience impressions? Use a significance level of α=0.05. Determine the null and alternative hypotheses for this test. Determine the correlation coefficient. Audience Impressions 14 22 28 26 25 27 19 18 28 Albums Sold 10 6 7 5 15...
help asap e. Use a 1% level of significance to test the claim that there is a negative linear correlation betw...
 help asap
e. Use a 1% level of significance to test the claim that there is a negative linear correlation between the age and number of text messages sent. (In other words, is the Sample Regression Line Useful for Predictions?) Make sure to show ALL steps of the hypothesis test, including a sketch. Write your conclusion in a complete and correct sentence in plain English. on company has reported that the number of text messages that a person sends tends...
help asap
e. Use a 1% level of significance to test the claim that there is a negative linear correlation between the age and number of text messages sent. (In other words, is the Sample Regression Line Useful for Predictions?) Make sure to show ALL steps of the hypothesis test, including a sketch. Write your conclusion in a complete and correct sentence in plain English. on company has reported that the number of text messages that a person sends tends...
Use only the Excel functions (no calculator). I need to see all Excel formulas to give...
 Use only the Excel functions (no calculator). I need to see all Excel formulas to give you a full credit. 1. (Sheet #1) (10 points) Use the following categorical frequency distribution to answer each problem. Top Cell Phone Providers Verizon US Cellular T-Mobile Sprint Other AT&T Number of Students 271 87 206 177 35 224 a. (4 pts) Create a pie chart and pareto chart. b. (3 pts) Add two more columns: Relative Frequency (rf) and Cumulative Relative Frequency (ert)....
(1 point) Here we investigate whether the register balance at a local retail store is better...
 (1 point) Here we investigate whether the register balance at a local retail store is better on days with a manager than days without a manager. This evidence might be used to determine whether or not you should always schedule a manager. The table gives the register balance for a sample of 10 days with a manager and 10 days without a manager. Here, O means the register balance is right on, negative means there is less money than there...
Question 8 to question 19 are true or false Subject: ADMN210- Applied Business Statistics 8) A...
 Question 8 to question 19 are true or false Subject: ADMN210-
Applied Business Statistics
8) A hypothesis test always contains the possibility of committing one of two types of errors callled Type I and Type lI errors d u e avoda b 9) The null hypothesis is rejected if the p-value is greater than the significance level 10) The probability of committing a Type I error is called the level of significance 11) In hypothesis testing the statistical conclusion is...
Question 8 to question 19 are true or false Subject: ADMN210-
Applied Business Statistics
8) A hypothesis test always contains the possibility of committing one of two types of errors callled Type I and Type lI errors d u e avoda b 9) The null hypothesis is rejected if the p-value is greater than the significance level 10) The probability of committing a Type I error is called the level of significance 11) In hypothesis testing the statistical conclusion is...
Please help, Thanks! The scores of 8 students on the midterm exam and final exam were...
 Please help, Thanks!
The scores of 8 students on the midterm exam and final exam were as follows. Student Anderson Bailey Cruz DeSana Erickson Francis Gray Harris Midterm 99 92 92 91 84 83 Final 100 82 71 80 85 72 92 88 80 75 Find the value of the (Spearman's) rank correlation coefficient test statistic that would be used to test the claim of no correlation between midterm score and final exam score. Round your answer to 3 places...
Please help, Thanks!
The scores of 8 students on the midterm exam and final exam were as follows. Student Anderson Bailey Cruz DeSana Erickson Francis Gray Harris Midterm 99 92 92 91 84 83 Final 100 82 71 80 85 72 92 88 80 75 Find the value of the (Spearman's) rank correlation coefficient test statistic that would be used to test the claim of no correlation between midterm score and final exam score. Round your answer to 3 places...
A sociologist is interested in the relation between x = number of job changes and y...
A sociologist is interested in the relation between x = number of job changes and y = annual salary (in thousands of dollars) for people living in the Nashville area. A random sample of 10 people employed in Nashville provided the following information. x (number of job changes) 3 7 6 6 1 5 9 10 10 3 y (Salary in $1000) 34 33 38 32 32 38 43 37 40 33 In this setting we have Σx = 60,...
 Question 47 (20 points) A local tire dealer wants to predict the number of tires sold each month. He believes that the number of tires sold is a linear function of the amount of money invested in advertising. He randomly selects 6 months of data consisting of tire sales (in thousands of tires) and advertising expenditures (in thousands of dollars). Based on the data set with 6 observations, the simple linear regression model yielded the following results. X = 24...
 1) (15%) For Applied Management Statistics class you want to know how college students feel about the transportation system in Barcelona. a) What is the population in this study? b) What type of sample would you use and why? 2) (25%) A manager of an e-commerce company would like to determine average delivery time of the products. A sample of 25 customers is taken. The average delivery time in the sample was four days. Suppose the delivery times are normally...
 Use only the Excel functions (no calculator). I need to see all
Excel formulas to give you a full credit. Give answers to the 4th
decimal place.
1. (Sheet #1) (10 points) Use the following categorical
frequency distribution to answer each problem. a. (4 pts) Create a
pie chart and pareto chart. b. (3 pts) Add two more columns:
Relative Frequency (rf) and Cumulative Relative Frequency (crf).
Calculate rf and crf. c. (1 pt.) Find a mean. d. (1 pt.)...
Use only the Excel functions (no calculator). I need to see all
Excel formulas to give you a full credit. Give answers to the 4th
decimal place.
1. (Sheet #1) (10 points) Use the following categorical
frequency distribution to answer each problem. a. (4 pts) Create a
pie chart and pareto chart. b. (3 pts) Add two more columns:
Relative Frequency (rf) and Cumulative Relative Frequency (crf).
Calculate rf and crf. c. (1 pt.) Find a mean. d. (1 pt.)...
 help asap
e. Use a 1% level of significance to test the claim that there is a negative linear correlation between the age and number of text messages sent. (In other words, is the Sample Regression Line Useful for Predictions?) Make sure to show ALL steps of the hypothesis test, including a sketch. Write your conclusion in a complete and correct sentence in plain English. on company has reported that the number of text messages that a person sends tends...
help asap
e. Use a 1% level of significance to test the claim that there is a negative linear correlation between the age and number of text messages sent. (In other words, is the Sample Regression Line Useful for Predictions?) Make sure to show ALL steps of the hypothesis test, including a sketch. Write your conclusion in a complete and correct sentence in plain English. on company has reported that the number of text messages that a person sends tends...
 Use only the Excel functions (no calculator). I need to see all Excel formulas to give you a full credit. 1. (Sheet #1) (10 points) Use the following categorical frequency distribution to answer each problem. Top Cell Phone Providers Verizon US Cellular T-Mobile Sprint Other AT&T Number of Students 271 87 206 177 35 224 a. (4 pts) Create a pie chart and pareto chart. b. (3 pts) Add two more columns: Relative Frequency (rf) and Cumulative Relative Frequency (ert)....
 (1 point) Here we investigate whether the register balance at a local retail store is better on days with a manager than days without a manager. This evidence might be used to determine whether or not you should always schedule a manager. The table gives the register balance for a sample of 10 days with a manager and 10 days without a manager. Here, O means the register balance is right on, negative means there is less money than there...
 Question 8 to question 19 are true or false Subject: ADMN210-
Applied Business Statistics
8) A hypothesis test always contains the possibility of committing one of two types of errors callled Type I and Type lI errors d u e avoda b 9) The null hypothesis is rejected if the p-value is greater than the significance level 10) The probability of committing a Type I error is called the level of significance 11) In hypothesis testing the statistical conclusion is...
Question 8 to question 19 are true or false Subject: ADMN210-
Applied Business Statistics
8) A hypothesis test always contains the possibility of committing one of two types of errors callled Type I and Type lI errors d u e avoda b 9) The null hypothesis is rejected if the p-value is greater than the significance level 10) The probability of committing a Type I error is called the level of significance 11) In hypothesis testing the statistical conclusion is...
 Please help, Thanks!
The scores of 8 students on the midterm exam and final exam were as follows. Student Anderson Bailey Cruz DeSana Erickson Francis Gray Harris Midterm 99 92 92 91 84 83 Final 100 82 71 80 85 72 92 88 80 75 Find the value of the (Spearman's) rank correlation coefficient test statistic that would be used to test the claim of no correlation between midterm score and final exam score. Round your answer to 3 places...
Please help, Thanks!
The scores of 8 students on the midterm exam and final exam were as follows. Student Anderson Bailey Cruz DeSana Erickson Francis Gray Harris Midterm 99 92 92 91 84 83 Final 100 82 71 80 85 72 92 88 80 75 Find the value of the (Spearman's) rank correlation coefficient test statistic that would be used to test the claim of no correlation between midterm score and final exam score. Round your answer to 3 places...
Most questions answered within 3 hours.
-
Where is the error in this code sequence?
String s1 = "Hello";
String s2 = "ello";...
asked 10 months ago -
Financial data for Joel de Paris, Inc., for last year
follow:
Joel de Paris, Inc.
Balance...
asked 10 months ago -
Consider this reaction:
Al2(SO4)3 (aq)+ BaCl3
(aq) Al2Cl6 (aq)- +
3BaSO4(s) . What is the...
asked 10 months ago -
Suppose that Savneet is considering increasing her
recent random sample from 20 car rentals to 40...
asked 10 months ago -
Trucks arrive at an unloading terminal at an average rate of 120
per hour.
Trucks arrive...
asked 10 months ago -
Why are methanol and ethanol completely soluble in water while
octanol is not very little soluble....
asked 10 months ago -
A facilities manager at a university reads in a research report
that the mean amount of...
asked 10 months ago -
When the CuSO4 is rehydrated by adding water to the anhydrous
compound, is this an endothermic...
asked 10 months ago -
A ray of sunlight is passing from diamond into crown glass; the
angle of incidence is...
asked 10 months ago -
A block of mass 0.249 kg is placed on top of a light, vertical
spring of...
asked 10 months ago -
how do the kidneys compensate in the presences of acidosis
a) trigger hyperventilate
b) reserve acid...
asked 10 months ago -
Question 501 pts
The rental rate of capital to the firm increases. Which of the
following...
asked 10 months ago