
Homework Answers

Add Answer to:
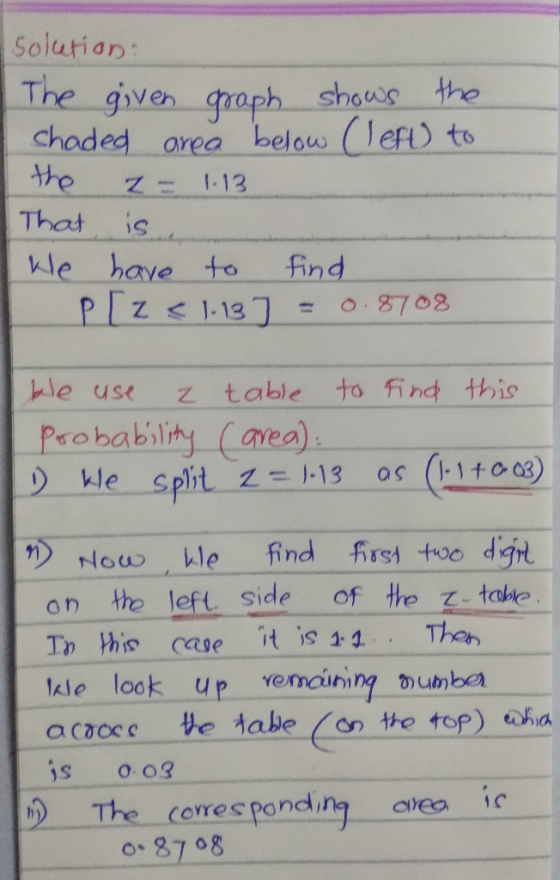
can you please show step be step
Find the area of the shaded region. The graph...
Find the area of the shaded region. The graph depicts the standard normal distribution with mean...
 Find the area of the shaded region. The graph depicts the standard normal distribution with mean 0 and standard deviation 1. -3.39 2.26 -1.13 1132263393 B) 0.8708 A) 0.8907 C) 0.8485 D) 0.1292 -1.82 A) -0.0344 B) 0.4656 C) 0.0344 D) 0.9656 Find the indicated z score. The graph depicts the standard normal distribution with meant and standard deviation 1. 3) Shaded area is 0.4013. 0.40131 A) 0.25 B) 0.57 C) -025 D) -0.57
find the area of the shaded region. the graph depicts the standard normal distribution Find the...
 find the area of the shaded region. the graph depicts the
standard normal distribution
Find the area of the shaded region. The graph depicts the standard deviation 1. normal distribution with mean 0 and standar 1) 1) 1.13 226 339 -3.39 -226 -1.13 B) 0.1292 C) 0.8708 D) 0.8907 A) 0.8485 2) 2) Round to four decimal places. 2.95-2.36-1.77-1.18-059 059 1.18 1.77 236 3) Round to four decimal places. 3) -2.16 -1.08 1.08 216 Find the indicated z score. The...
find the area of the shaded region. the graph depicts the
standard normal distribution
Find the area of the shaded region. The graph depicts the standard deviation 1. normal distribution with mean 0 and standar 1) 1) 1.13 226 339 -3.39 -226 -1.13 B) 0.1292 C) 0.8708 D) 0.8907 A) 0.8485 2) 2) Round to four decimal places. 2.95-2.36-1.77-1.18-059 059 1.18 1.77 236 3) Round to four decimal places. 3) -2.16 -1.08 1.08 216 Find the indicated z score. The...
1.) Find the area of the shaded region. The graph depicts the standard normal distribution with...
 1.) Find the area of the shaded region. The graph
depicts the standard normal distribution with mean 0 and standard
deviation 1.
0.8485
0.8708
0.1292
0.8907
2.)Find the area of the shaded region. The graph depicts
the standard normal distribution with mean 0 and standard deviation
1.
0.7224
0.2190
0.2224
0.2776
3.)Find the area of the shaded region. The graph depicts
the standard normal distribution with mean 0 and standard deviation
1.
0.9656
-0.0344
0.0344
0.4656
1.) Find the area of the shaded region. The graph
depicts the standard normal distribution with mean 0 and standard
deviation 1.
0.8485
0.8708
0.1292
0.8907
2.)Find the area of the shaded region. The graph depicts
the standard normal distribution with mean 0 and standard deviation
1.
0.7224
0.2190
0.2224
0.2776
3.)Find the area of the shaded region. The graph depicts
the standard normal distribution with mean 0 and standard deviation
1.
0.9656
-0.0344
0.0344
0.4656
0-0.57 00.57 4. Find the area of the shaded region. The graph depicts the standard normal...
 0-0.57 00.57 4. Find the area of the shaded region. The graph depicts the standard normal distribution with mean 0 and standard deviation 1. -339-226-113 1.13 226 339z о 0.8907 01292 0.8708 0.8485 ind the indicated z score. The graph depicts the standard norn
find the area of the shaded region. the graph depicts tge standard normal distribution with mean...
 find the area of the shaded region. the graph depicts tge standard
normal distribution with mean 0 and standard deviation 1.
Find the area of the shaded region. The grap with mean 0 and standard deviation 1. 339 26 -11 1.13 126339 00.8907 00.1292 00.8708 0.8485 Using the following uniform density curve, answer
find the area of the shaded region. the graph depicts tge standard
normal distribution with mean 0 and standard deviation 1.
Find the area of the shaded region. The grap with mean 0 and standard deviation 1. 339 26 -11 1.13 126339 00.8907 00.1292 00.8708 0.8485 Using the following uniform density curve, answer
Find the area of the shaded region
 Find the area of the shaded region. The graph depicts the standard normal distribution of bone density scores with mean 0 and standard deviation 1. The area of the shaded region is _______
Find the area of the shaded region. The graph depicts the standard normal distribution of bone...
 Find the area of the shaded region. The graph depicts the standard normal distribution of bone density scores with mean and standard deviation 1 The area of the shaded regionis (Round to four decimal places as needed) Find the res of the shaded region. The graph depicts the standard normal distribution of bone density score with mean and standard deviation 1 The area of the shaded region is Round to four decimal places as needed
3. Find the area of the shaded region. The graph depicts the standard normal distribution (1...
 3. Find the area of the shaded region. The graph depicts the standard normal distribution (1 point) with mean 0 and standard deviation 1. -2.341.17 117 234 z 0.1210 0.7580 0.8790 0.2420 0 4. Find the indicated z score. The graph depicts the standard normal distribution with(1 point) mean 0 and standard deviation 1 Shaded area is 0.0901
Find the area of the shaded region. The graph depicts the standard normal distribution with...
 Find the area of the shaded region. The graph depicts the standard normal distribution with mean 0 and standard deviation 1. z = 0.45 The area of the shaded region is _______ (Round to four decimal places as needed.)
Find the area of the shaded region
 Find the area of the shaded region. The graph depicts the standard normal distribution of bone density scores with mean 0 and standard deviation 1. The area of the shaded region is _______ (Round to four decimal places as needed.)
 Find the area of the shaded region. The graph depicts the standard normal distribution with mean 0 and standard deviation 1. -3.39 2.26 -1.13 1132263393 B) 0.8708 A) 0.8907 C) 0.8485 D) 0.1292 -1.82 A) -0.0344 B) 0.4656 C) 0.0344 D) 0.9656 Find the indicated z score. The graph depicts the standard normal distribution with meant and standard deviation 1. 3) Shaded area is 0.4013. 0.40131 A) 0.25 B) 0.57 C) -025 D) -0.57
 find the area of the shaded region. the graph depicts the
standard normal distribution
Find the area of the shaded region. The graph depicts the standard deviation 1. normal distribution with mean 0 and standar 1) 1) 1.13 226 339 -3.39 -226 -1.13 B) 0.1292 C) 0.8708 D) 0.8907 A) 0.8485 2) 2) Round to four decimal places. 2.95-2.36-1.77-1.18-059 059 1.18 1.77 236 3) Round to four decimal places. 3) -2.16 -1.08 1.08 216 Find the indicated z score. The...
find the area of the shaded region. the graph depicts the
standard normal distribution
Find the area of the shaded region. The graph depicts the standard deviation 1. normal distribution with mean 0 and standar 1) 1) 1.13 226 339 -3.39 -226 -1.13 B) 0.1292 C) 0.8708 D) 0.8907 A) 0.8485 2) 2) Round to four decimal places. 2.95-2.36-1.77-1.18-059 059 1.18 1.77 236 3) Round to four decimal places. 3) -2.16 -1.08 1.08 216 Find the indicated z score. The...
 1.) Find the area of the shaded region. The graph
depicts the standard normal distribution with mean 0 and standard
deviation 1.
0.8485
0.8708
0.1292
0.8907
2.)Find the area of the shaded region. The graph depicts
the standard normal distribution with mean 0 and standard deviation
1.
0.7224
0.2190
0.2224
0.2776
3.)Find the area of the shaded region. The graph depicts
the standard normal distribution with mean 0 and standard deviation
1.
0.9656
-0.0344
0.0344
0.4656
1.) Find the area of the shaded region. The graph
depicts the standard normal distribution with mean 0 and standard
deviation 1.
0.8485
0.8708
0.1292
0.8907
2.)Find the area of the shaded region. The graph depicts
the standard normal distribution with mean 0 and standard deviation
1.
0.7224
0.2190
0.2224
0.2776
3.)Find the area of the shaded region. The graph depicts
the standard normal distribution with mean 0 and standard deviation
1.
0.9656
-0.0344
0.0344
0.4656
 0-0.57 00.57 4. Find the area of the shaded region. The graph depicts the standard normal distribution with mean 0 and standard deviation 1. -339-226-113 1.13 226 339z о 0.8907 01292 0.8708 0.8485 ind the indicated z score. The graph depicts the standard norn
 find the area of the shaded region. the graph depicts tge standard
normal distribution with mean 0 and standard deviation 1.
Find the area of the shaded region. The grap with mean 0 and standard deviation 1. 339 26 -11 1.13 126339 00.8907 00.1292 00.8708 0.8485 Using the following uniform density curve, answer
find the area of the shaded region. the graph depicts tge standard
normal distribution with mean 0 and standard deviation 1.
Find the area of the shaded region. The grap with mean 0 and standard deviation 1. 339 26 -11 1.13 126339 00.8907 00.1292 00.8708 0.8485 Using the following uniform density curve, answer
 Find the area of the shaded region. The graph depicts the standard normal distribution of bone density scores with mean and standard deviation 1 The area of the shaded regionis (Round to four decimal places as needed) Find the res of the shaded region. The graph depicts the standard normal distribution of bone density score with mean and standard deviation 1 The area of the shaded region is Round to four decimal places as needed
 3. Find the area of the shaded region. The graph depicts the standard normal distribution (1 point) with mean 0 and standard deviation 1. -2.341.17 117 234 z 0.1210 0.7580 0.8790 0.2420 0 4. Find the indicated z score. The graph depicts the standard normal distribution with(1 point) mean 0 and standard deviation 1 Shaded area is 0.0901
Most questions answered within 3 hours.
-
Where is the error in this code sequence?
String s1 = "Hello";
String s2 = "ello";...
asked 10 months ago -
Financial data for Joel de Paris, Inc., for last year
follow:
Joel de Paris, Inc.
Balance...
asked 10 months ago -
Consider this reaction:
Al2(SO4)3 (aq)+ BaCl3
(aq) Al2Cl6 (aq)- +
3BaSO4(s) . What is the...
asked 10 months ago -
Suppose that Savneet is considering increasing her
recent random sample from 20 car rentals to 40...
asked 10 months ago -
Trucks arrive at an unloading terminal at an average rate of 120
per hour.
Trucks arrive...
asked 10 months ago -
Why are methanol and ethanol completely soluble in water while
octanol is not very little soluble....
asked 10 months ago -
A facilities manager at a university reads in a research report
that the mean amount of...
asked 10 months ago -
When the CuSO4 is rehydrated by adding water to the anhydrous
compound, is this an endothermic...
asked 10 months ago -
A ray of sunlight is passing from diamond into crown glass; the
angle of incidence is...
asked 10 months ago -
A block of mass 0.249 kg is placed on top of a light, vertical
spring of...
asked 10 months ago -
how do the kidneys compensate in the presences of acidosis
a) trigger hyperventilate
b) reserve acid...
asked 10 months ago -
Question 501 pts
The rental rate of capital to the firm increases. Which of the
following...
asked 10 months ago