Confidence Interval for p: Suppose that 60 out of 100 sampled FIU voting-eligible students, support the...
Homework Answers
a) Best guess for the proportion of students who will vote for Joanna: 60%
b)
he following information is provided: The sample size is N = 100, the number of favorable cases is X = 60, and the sample proportion is p=0.6, and the significance level is alpha =0.05
(1) Null and Alternative Hypotheses
The following null and alternative hypotheses need to be tested:
Ho: p = 0.6
Ha: p not= 0.6
This corresponds to a two-tailed test, for which a z-test for one population proportion needs to be used.
z_c = 1.96

it is then concluded that the null hypothesis is not rejected.
the 95% confidence interval for p is: 0.504 & < 0.6960 i.e 504<p<0.696
c)
he following information is provided: The sample size is N = 100, the number of favorable cases is X = 60X=60, and the sample proportion is pˉ=0.6, and the significance level is alpha =0.05
(1) Null and Alternative Hypotheses
The following null and alternative hypotheses need to be tested:
Ho: p = 0.55
Ha: p≠ 0.55
Based on the information provided, the significance level is alpha =0.05, and the critical value for a two-tailed test is z_c = 1.96.

Since it is observed that |∣z∣=1.005 ≤ zc=1.96, it is then concluded that the null hypothesis is not rejected.
It is concluded that the null hypothesis Ho is not rejected. Therefore, there is not enough evidence to claim that the population proportion p is different than p0, at the alpha =0.05 significance level.
the 95% confidence interval for p is 0.504 < p < 0.696
which says, 0.55 belongs to the CI
d)
The following information is provided: The sample size is N =100, the number of favorable cases is X =60, and the sample proportion is \pˉ=0.6, and the significance level is alpha = 0.05
(1) Null and Alternative Hypotheses
The following null and alternative hypotheses need to be tested:
Ho: p = 0.5
Ha:p≠0.5
Based on the information provided, the significance level is \alpha = 0.05α=0.05, and the critical value for a two-tailed test is z_c = 1.96
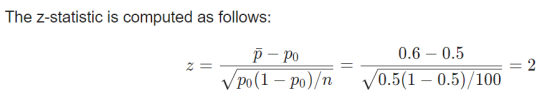
Since it is observed that ∣z∣=2>zc=1.96, it is then concluded that the null hypothesis is rejected.
it is concluded that the null hypothesis Ho is rejected. Therefore, there is enough evidence to claim that the population proportion p is different than p_0, at the alpha 0.05 significance level.
The 95% confidence interval for p is:0.504<p<0.696.
Which says 0.5 does not belongs to the CI
Add Answer to:
Confidence Interval for p: Suppose that 60 out of 100 sampled
FIU voting-eligible students, support the...
Citizen registration and voting varies by age and gender
Citizen registration and voting varies by age and gender. The following data is based on registration and voting results from the Current Population Survey following the 2012 election. A survey was conducted of adults eligible to vote. The respondents were asked in they registered to vote. The data below are based on a total sample of 760. We will focus on the proportion who voted for males and for females. There is no expectation that one group is more likely...
Citizen registration and voting varies by age and gender. The following data is based on registration...
 Citizen registration and voting varies by age and gender. The following data is based on registration and voting results from the Current Population Survey following the 2012 election. A survey was conducted of adults eligible to vote. The respondents were asked in they registered to vote. The data below are based on a total sample of 760. We will focus on the proportion who voted for males and for females. There is no expectation that one group is more likely...
In a random sample of 100 registered voters, 20 say they plan to vote for Candidate A. Determine a 95% confidence interval for the proportion of all the registered voters who will vote for Candida...
In a random sample of 100 registered voters, 20 say they plan to vote for Candidate A.Determine a 95% confidence interval for the proportion of all the registered voters who will vote for Candidate A.You are interested in knowing support for candidate by gender to provide strategic advice to candidate B. Suppose your guess based on previous knowledge is that female support for candidate B is around 20 percent, and male support for candidate B is around 50 percent. Suppose...
1.) Voting records show that 61% of eligible voters actually did vote in a recent presidential...
1.) Voting records show that 61% of eligible voters actually did vote in a recent presidential election. In a survey of 1002 people, 70% said that they voted in that election. Use the survey results to test the claim that the percentage of all voters who say that they voted is equal to 61%. Test the claim by constructing an appropriate confidence interval. What are the null and alternative hypotheses? What is the value of = significance level? Is the...
(a) A newspaper conducted a statewide survey concerning the 1998 race for state senator. The newspaper...
 (a) A newspaper conducted a statewide survey concerning the 1998 race for state senator. The newspaper took a SRS of 1200 registered voters and found that 620 would vote for the Republican candidate. Let p represent the proportion of registered voters in the state who would vote for the Republican candidate. A 90 percent confidence interval for p is: A. 0.517 t0.024 B. 0.517 ± 0.014 C. 0.517 ± 0.249 D. 0.517 +0.028 (b) A newspaper conducted a statewide survey...
The Student Recreation Center wanted to determine what sort of physical activity was preferred by students....
The Student Recreation Center wanted to determine what sort of physical activity was preferred by students. In a survey of 59 random students, 37 indicated that they preferred outdoor exercise over exercising in a gym. The 90% confidence interval estimating the proportion of all students at the university who prefer outdoor exercise is given by which of the following? Question 7 options: 1) ( 0.26933 , 0.47643 ) 2) ( 0.56416 , 0.69007 ) 3) ( 0.54644 , 0.7078 )...
all answers ! 5. The actual time it takes to cook a ten-pound turkey is a...
 all answers !
5. The actual time it takes to cook a ten-pound turkey is a normally distributed. Suppose that a random sample of 20 ten pound turkeys is taken with a sample mean of 2.9 hours and a sample standard deviation of 0.24 hours. Calculate a 95% confidence interval for the average cooking time of a ten pound turkey. 6. A recent Gallop poll showed Trump's approval rating 40% with a margin or error of 3%. a) Find the...
all answers !
5. The actual time it takes to cook a ten-pound turkey is a normally distributed. Suppose that a random sample of 20 ten pound turkeys is taken with a sample mean of 2.9 hours and a sample standard deviation of 0.24 hours. Calculate a 95% confidence interval for the average cooking time of a ten pound turkey. 6. A recent Gallop poll showed Trump's approval rating 40% with a margin or error of 3%. a) Find the...
1) Out of 100 people sampled, 60 preferred Candidate A. Based on this, estimate what proportion...
1) Out of 100 people sampled, 60 preferred Candidate A. Based on this, estimate what proportion of the voting population (pp) prefers Candidate A. Use a 99% confidence level, and give your answers as decimals, to three places. _____ < P < ______ 2) You work for a marketing firm that has a large client in the automobile industry. You have been asked to estimate the proportion of households in Chicago that have two or more vehicles. You have been...
Please do in Rstudio **5)Find a 95% confidence interval for the proportion of students that pass...
Please do in Rstudio **5)Find a 95% confidence interval for the proportion of students that pass their first high school class. "Class" is a random sample collected by asking students who walk in the main door of the school on the first day of the second semester** ```{r} Class<-c("P","F","P","P","P","P","F","P","P","P","P","F","P","P","P","P","F","P","P","P","P","F","P","P","P","P","F","P","P","P","P","F","P","P","P","P","F","P","P","P","F","F","F","F","P","F","P","P","P","P","F","P","P","P","P","F","P","P","P","F","F", "P") ###Please do your work here### ############################## ``` **How would you interpret this confidence interval? Please type your answer on the line below ** Answer:
Can anyone please help me with my Confidence Intervals for Proportions homework? Thank you so much! 1....
Can anyone please help me with my Confidence Intervals for Proportions homework? Thank you so much! 1. Express the confidence interval 38.6%±9%38.6%±9% in interval form. Express the answer in decimal format (do not enter as percents). 2. We wish to estimate what percent of adult residents in a certain county are parents. Out of 100 adult residents sampled, 26 had kids. Based on this, construct a 95% confidence interval for the proportion, p, of adult residents who are parents in this...
 Citizen registration and voting varies by age and gender. The following data is based on registration and voting results from the Current Population Survey following the 2012 election. A survey was conducted of adults eligible to vote. The respondents were asked in they registered to vote. The data below are based on a total sample of 760. We will focus on the proportion who voted for males and for females. There is no expectation that one group is more likely...
 (a) A newspaper conducted a statewide survey concerning the 1998 race for state senator. The newspaper took a SRS of 1200 registered voters and found that 620 would vote for the Republican candidate. Let p represent the proportion of registered voters in the state who would vote for the Republican candidate. A 90 percent confidence interval for p is: A. 0.517 t0.024 B. 0.517 ± 0.014 C. 0.517 ± 0.249 D. 0.517 +0.028 (b) A newspaper conducted a statewide survey...
 all answers !
5. The actual time it takes to cook a ten-pound turkey is a normally distributed. Suppose that a random sample of 20 ten pound turkeys is taken with a sample mean of 2.9 hours and a sample standard deviation of 0.24 hours. Calculate a 95% confidence interval for the average cooking time of a ten pound turkey. 6. A recent Gallop poll showed Trump's approval rating 40% with a margin or error of 3%. a) Find the...
all answers !
5. The actual time it takes to cook a ten-pound turkey is a normally distributed. Suppose that a random sample of 20 ten pound turkeys is taken with a sample mean of 2.9 hours and a sample standard deviation of 0.24 hours. Calculate a 95% confidence interval for the average cooking time of a ten pound turkey. 6. A recent Gallop poll showed Trump's approval rating 40% with a margin or error of 3%. a) Find the...
Most questions answered within 3 hours.
-
Where is the error in this code sequence?
String s1 = "Hello";
String s2 = "ello";...
asked 10 months ago -
Financial data for Joel de Paris, Inc., for last year
follow:
Joel de Paris, Inc.
Balance...
asked 10 months ago -
Consider this reaction:
Al2(SO4)3 (aq)+ BaCl3
(aq) Al2Cl6 (aq)- +
3BaSO4(s) . What is the...
asked 10 months ago -
Suppose that Savneet is considering increasing her
recent random sample from 20 car rentals to 40...
asked 10 months ago -
Trucks arrive at an unloading terminal at an average rate of 120
per hour.
Trucks arrive...
asked 10 months ago -
Why are methanol and ethanol completely soluble in water while
octanol is not very little soluble....
asked 10 months ago -
A facilities manager at a university reads in a research report
that the mean amount of...
asked 10 months ago -
When the CuSO4 is rehydrated by adding water to the anhydrous
compound, is this an endothermic...
asked 10 months ago -
A ray of sunlight is passing from diamond into crown glass; the
angle of incidence is...
asked 10 months ago -
A block of mass 0.249 kg is placed on top of a light, vertical
spring of...
asked 10 months ago -
how do the kidneys compensate in the presences of acidosis
a) trigger hyperventilate
b) reserve acid...
asked 10 months ago -
Question 501 pts
The rental rate of capital to the firm increases. Which of the
following...
asked 10 months ago