Question

Here is a summary table for the variable HINCP split by new_FS.
| new_FS | n | min | median | mean | max |
|---|---|---|---|---|---|
| Food stamps | 641 | -4600 | 38400 | 64901.88 | 958700 |
| No food stamps | 13471 | -4800 | 124000 | 164488.83 | 2580000 |
Taking the table and histogram into account, answer the questions.
-
What is the appropriate measure of spread for distribution of HINCP for people on food stamps?
-
Please explain in context what the measure of center of HINCP for people on food stamps means?
-
How are the distributions of HINCP for those on food stamps and not on food stamps different and similar?
-
What do you find surprising for either distribution?
- Do you think the distribution of HINCP is the same or different for people who are on or not on food stamps? Cite as much evidence as possible from the graphs and tables abov
Homework Answers
Answer #1
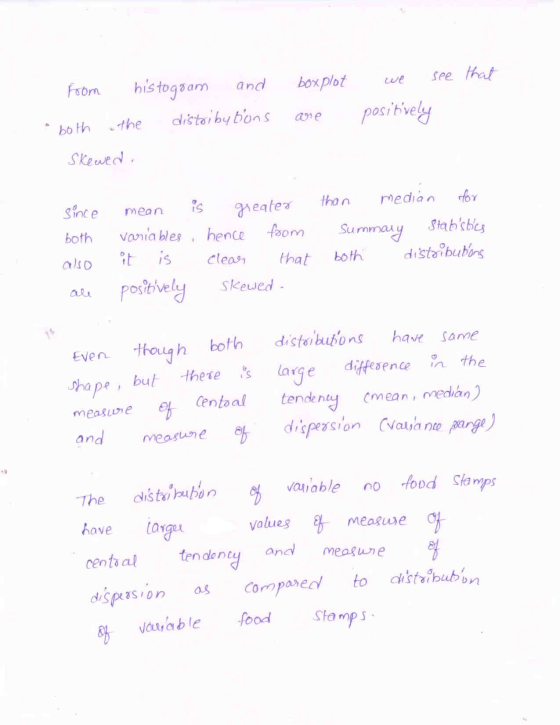
see that From histogram and both the distributions Skewed. boxplot are we positively Since both also ale mean is greater variables, hence from it is clear that positively skewed. than median for Summary statistics both distributions Even though both shape, but there is measure of centoal and measure of distributions have same large difference in the tendency cmean, median) dispersion cvaesance prange) The distribution of variable no food Stamps have larger values of measure of central tendency and measure of dispersion as compared to distribution of voulable food Stamps
Know the answer?
Add Answer to:
Here is a summary table for the variable HINCP split by
new_FS.
new_FS
n
min
median...
Not the answer you're looking for?
Ask your own homework help question.
Our experts will answer your question WITHIN MINUTES for Free.
Similar Homework Help Questions
ADVERTISEMENT
Need Online Homework Help?
Ask
a QuestionGet Answers For Free
Most questions answered within 3 hours.
Most questions answered within 3 hours.
ADVERTISEMENT
Active Questions
-
Where is the error in this code sequence?
String s1 = "Hello";
String s2 = "ello";...
asked 10 months ago -
Financial data for Joel de Paris, Inc., for last year
follow:
Joel de Paris, Inc.
Balance...
asked 10 months ago -
Consider this reaction:
Al2(SO4)3 (aq)+ BaCl3
(aq) Al2Cl6 (aq)- +
3BaSO4(s) . What is the...
asked 10 months ago -
Suppose that Savneet is considering increasing her
recent random sample from 20 car rentals to 40...
asked 10 months ago -
Trucks arrive at an unloading terminal at an average rate of 120
per hour.
Trucks arrive...
asked 10 months ago -
Why are methanol and ethanol completely soluble in water while
octanol is not very little soluble....
asked 10 months ago -
A facilities manager at a university reads in a research report
that the mean amount of...
asked 10 months ago -
When the CuSO4 is rehydrated by adding water to the anhydrous
compound, is this an endothermic...
asked 10 months ago -
A ray of sunlight is passing from diamond into crown glass; the
angle of incidence is...
asked 10 months ago -
A block of mass 0.249 kg is placed on top of a light, vertical
spring of...
asked 10 months ago -
how do the kidneys compensate in the presences of acidosis
a) trigger hyperventilate
b) reserve acid...
asked 10 months ago -
Question 501 pts
The rental rate of capital to the firm increases. Which of the
following...
asked 10 months ago
ADVERTISEMENT