
Homework Answers

Add Answer to:
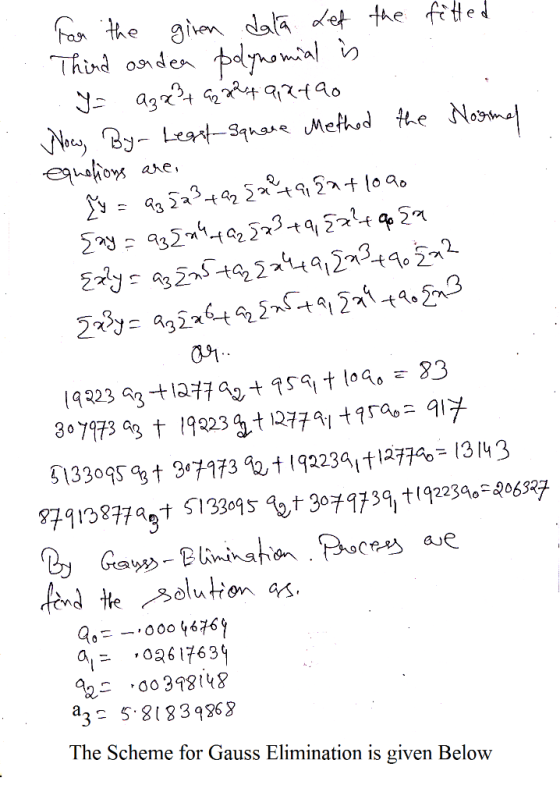
Question 3 O out of 2.5 points Fit the following data to a Third order Polynomial...
PolynomialFit Video Tutorial for this problem -- 7 min Please read through example 11.10.3 Polynomial Fit...
 PolynomialFit Video Tutorial for this problem -- 7 min Please read through example 11.10.3 Polynomial Fit and study its solution. Now solve for the 3rd order polynomial coefficients (a0 through a3), when given row vectors x and y of length 4 for the x and y values of the four points that the polynomial must include. Finish the polynomialFit function below. Function Save C Reset DI MATLAB Documentation 4 1 function a = polynomialFit(x,y) % fit the 4 points in...
3) A 2nd-order Lagrange Interpolating Polynomial is to be fit to the following data points:(1)-1,1(2)4, 1(3)-9....
 3) A 2nd-order Lagrange Interpolating Polynomial is to be fit to the following data points:(1)-1,1(2)4, 1(3)-9. Determine the polynomial term corresponding to the data point f(3) 8. Be sure to simplify as much as possible. (Don't take time to write the other two terms.) (1 point)
3) 6 11 12 15 17 19 TO 7 12 :12 Use least-squares regression to fit a straight line to the list o...
 please solve it with codes in Matlab
3) 6 11 12 15 17 19 TO 7 12 :12 Use least-squares regression to fit a straight line to the list of data in the accompanying table. Give the slope and the intercept Compute the correlation coefficient Give an estimation of y for r 10 Slope: Intercept: Your answer: Your Answer Page 1 of 1
3) 6 11 12 15 17 19 TO 7 12 :12 Use least-squares regression to fit a...
please solve it with codes in Matlab
3) 6 11 12 15 17 19 TO 7 12 :12 Use least-squares regression to fit a straight line to the list of data in the accompanying table. Give the slope and the intercept Compute the correlation coefficient Give an estimation of y for r 10 Slope: Intercept: Your answer: Your Answer Page 1 of 1
3) 6 11 12 15 17 19 TO 7 12 :12 Use least-squares regression to fit a...
2. a) Find Ts(x), the third degree Taylor polynomial about x -0, for the function e2 b) Find a bound for the error in the interval [0, 1/2] 3. The following data is If all third order differences (not...
2. a) Find Ts(x), the third degree Taylor polynomial about x -0, for the function e2 b) Find a bound for the error in the interval [0, 1/2] 3. The following data is If all third order differences (not divided differences) are 2, determine the coefficient of x in P(x). prepared for a polynomial P of unknown degree P(x) 2 1 4 I need help with both. Thank you.
The following are data on age (in weeks) and crown-rump length (in millimeters) for fetuses. A...
 The following are data on age (in weeks) and crown-rump length (in millimeters) for fetuses. A scatterplot of the data is given to the right sary 2001 01 30 Age (x) 11 11 12 14 17 19 19 23 25 28 - Length (y) 65 65 108 108 159 166 177 227 233 282 0 10 20 a. Obtain the linear correlation coefficient b. Interpret the value ofr in terms of the linear relationship between the two variables c. Discuss...
Non-Polynomial Models ("Transforming" the Data) The four data points at right are measurements of the amount...
 Non-Polynomial Models ("Transforming" the Data) The four data points at right are measurements of the amount of mustard (y;) left behind in a container as a function of the force (x) you squeezed the bottle. You want to calibrate an analytic model y =f(x) for future mustard-container analysis You're considering the following five models for f(x) 6.4 6 4 i. f(x)-a+be for two unknown coefficients a and b for three unknown coefficients P, Q and S iii. f(x)-11x2 + 11x...
by using matlab linreg() function file given below On average, the surface area A of human...
 by using matlab
linreg() function file given below
On average, the surface area A of human beings is related to weight W and height H. Measurements of several individuals of height 180cm are provided below. It is believed that the following data can be modelled using an exponential equation A = aeBW W (kg) 70 2.1 75 2.12 77 2.15 80 2.20 82 2.22 84 2.23 87 2.26 90 2.30 A (m2) A. Show by hand with pen and paper...
by using matlab
linreg() function file given below
On average, the surface area A of human beings is related to weight W and height H. Measurements of several individuals of height 180cm are provided below. It is believed that the following data can be modelled using an exponential equation A = aeBW W (kg) 70 2.1 75 2.12 77 2.15 80 2.20 82 2.22 84 2.23 87 2.26 90 2.30 A (m2) A. Show by hand with pen and paper...
Determine the value of the coefficient of correlation, r, for the following data. X 2 6...
Determine the value of the coefficient of correlation, r, for the following data. X 2 6 7 11 16 17 21 Y 18 15 13 8 7 7 6 (Round the intermediate values to 3 decimal places. Round your answer to 3 decimal places.) r =
Determine the value of the coefficient of correlation, r, for the following data. X 4 6...
Determine the value of the coefficient of correlation, r, for the following data. X 4 6 7 11 16 17 21 Y 18 13 13 8 7 7 5 (Round the intermediate values to 3 decimal places. Round your answer to 3 decimal places.) r= ?
15.00 points Consider the following sample data Click here for the Excel Data File b. Calculate...
 15.00 points Consider the following sample data Click here for the Excel Data File b. Calculate b, and by What is the sample regression equation? (Round Intermediate calculations to at least 4 decimal places and final answers to 2 decimal places) c. Find the predicted value for y if x equals 22 27 and 32 (Round intermediate coefficient values and final answers to 2 decimal places.) If x= 22 If x=27 If x= 32
 PolynomialFit Video Tutorial for this problem -- 7 min Please read through example 11.10.3 Polynomial Fit and study its solution. Now solve for the 3rd order polynomial coefficients (a0 through a3), when given row vectors x and y of length 4 for the x and y values of the four points that the polynomial must include. Finish the polynomialFit function below. Function Save C Reset DI MATLAB Documentation 4 1 function a = polynomialFit(x,y) % fit the 4 points in...
 3) A 2nd-order Lagrange Interpolating Polynomial is to be fit to the following data points:(1)-1,1(2)4, 1(3)-9. Determine the polynomial term corresponding to the data point f(3) 8. Be sure to simplify as much as possible. (Don't take time to write the other two terms.) (1 point)
 please solve it with codes in Matlab
3) 6 11 12 15 17 19 TO 7 12 :12 Use least-squares regression to fit a straight line to the list of data in the accompanying table. Give the slope and the intercept Compute the correlation coefficient Give an estimation of y for r 10 Slope: Intercept: Your answer: Your Answer Page 1 of 1
3) 6 11 12 15 17 19 TO 7 12 :12 Use least-squares regression to fit a...
please solve it with codes in Matlab
3) 6 11 12 15 17 19 TO 7 12 :12 Use least-squares regression to fit a straight line to the list of data in the accompanying table. Give the slope and the intercept Compute the correlation coefficient Give an estimation of y for r 10 Slope: Intercept: Your answer: Your Answer Page 1 of 1
3) 6 11 12 15 17 19 TO 7 12 :12 Use least-squares regression to fit a...
 The following are data on age (in weeks) and crown-rump length (in millimeters) for fetuses. A scatterplot of the data is given to the right sary 2001 01 30 Age (x) 11 11 12 14 17 19 19 23 25 28 - Length (y) 65 65 108 108 159 166 177 227 233 282 0 10 20 a. Obtain the linear correlation coefficient b. Interpret the value ofr in terms of the linear relationship between the two variables c. Discuss...
 Non-Polynomial Models ("Transforming" the Data) The four data points at right are measurements of the amount of mustard (y;) left behind in a container as a function of the force (x) you squeezed the bottle. You want to calibrate an analytic model y =f(x) for future mustard-container analysis You're considering the following five models for f(x) 6.4 6 4 i. f(x)-a+be for two unknown coefficients a and b for three unknown coefficients P, Q and S iii. f(x)-11x2 + 11x...
 by using matlab
linreg() function file given below
On average, the surface area A of human beings is related to weight W and height H. Measurements of several individuals of height 180cm are provided below. It is believed that the following data can be modelled using an exponential equation A = aeBW W (kg) 70 2.1 75 2.12 77 2.15 80 2.20 82 2.22 84 2.23 87 2.26 90 2.30 A (m2) A. Show by hand with pen and paper...
by using matlab
linreg() function file given below
On average, the surface area A of human beings is related to weight W and height H. Measurements of several individuals of height 180cm are provided below. It is believed that the following data can be modelled using an exponential equation A = aeBW W (kg) 70 2.1 75 2.12 77 2.15 80 2.20 82 2.22 84 2.23 87 2.26 90 2.30 A (m2) A. Show by hand with pen and paper...
 15.00 points Consider the following sample data Click here for the Excel Data File b. Calculate b, and by What is the sample regression equation? (Round Intermediate calculations to at least 4 decimal places and final answers to 2 decimal places) c. Find the predicted value for y if x equals 22 27 and 32 (Round intermediate coefficient values and final answers to 2 decimal places.) If x= 22 If x=27 If x= 32
Most questions answered within 3 hours.
-
Where is the error in this code sequence?
String s1 = "Hello";
String s2 = "ello";...
asked 11 months ago -
Financial data for Joel de Paris, Inc., for last year
follow:
Joel de Paris, Inc.
Balance...
asked 11 months ago -
Consider this reaction:
Al2(SO4)3 (aq)+ BaCl3
(aq) Al2Cl6 (aq)- +
3BaSO4(s) . What is the...
asked 11 months ago -
Suppose that Savneet is considering increasing her
recent random sample from 20 car rentals to 40...
asked 11 months ago -
Trucks arrive at an unloading terminal at an average rate of 120
per hour.
Trucks arrive...
asked 11 months ago -
Why are methanol and ethanol completely soluble in water while
octanol is not very little soluble....
asked 11 months ago -
A facilities manager at a university reads in a research report
that the mean amount of...
asked 11 months ago -
When the CuSO4 is rehydrated by adding water to the anhydrous
compound, is this an endothermic...
asked 11 months ago -
A ray of sunlight is passing from diamond into crown glass; the
angle of incidence is...
asked 11 months ago -
A block of mass 0.249 kg is placed on top of a light, vertical
spring of...
asked 11 months ago -
how do the kidneys compensate in the presences of acidosis
a) trigger hyperventilate
b) reserve acid...
asked 11 months ago -
Question 501 pts
The rental rate of capital to the firm increases. Which of the
following...
asked 11 months ago