PLEASE SHOW ME HOW TO DO THIS....
 For
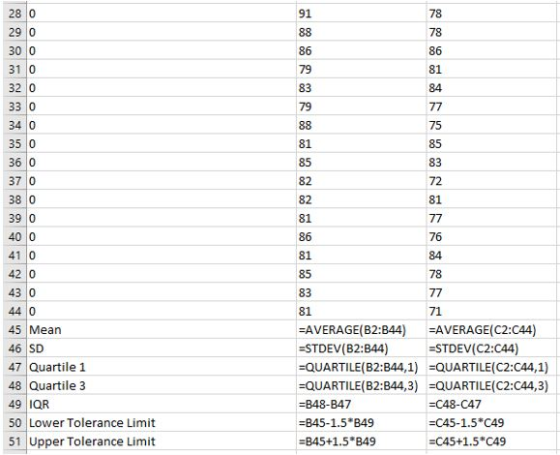
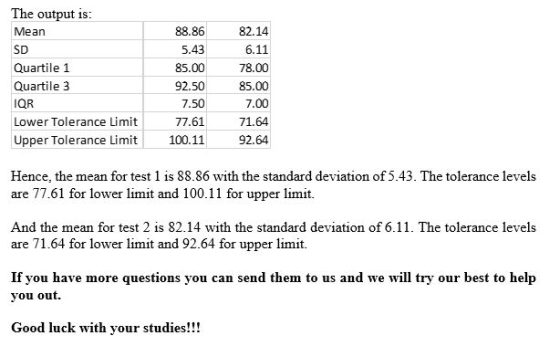
the Excel Data Set please find and report for Test 1 and Test 2 the
Mean, SD, and the tolerance levels for both for which there would
be any outliers (i.e., the value for which a score must be less
than to be consider an outlier and the value for which a number
must greater than to be considered an outlier.
For
the Excel Data Set please find and report for Test 1 and Test 2 the
Mean, SD, and the tolerance levels for both for which there would
be any outliers (i.e., the value for which a score must be less
than to be consider an outlier and the value for which a number
must greater than to be considered an outlier.
See picture
Homework Answers

Add Answer to:
PLEASE SHOW ME HOW TO DO THIS....
For
the Excel Data Set please find and report...
5. Mark’s class just took the admission test for business school and averaged 87.05. Chapter 10...
5. Mark’s class just took the admission test for business school and averaged 87.05. Chapter 10 Data Set 2 contains the population of scores for the 10 other classes in Mark’s university. How did Mark’s class do? Class 1 Class 2 Class 3 Class 4 Class 5 Class 6 Class 7 Class 8 Class 9 Class 10 78 81 96 85 88 78 90 79 96 86 77 78 97 90 88 82 86 93 87 89 78 93 88...
Pitcher 1 Pitcher 2 87 82 86 92 82 70 84 96 83 89 81 84 85 84 93 ...
 Pitcher 1
Pitcher 2
87
82
86
92
82
70
84
96
83
89
81
84
85
84
93
80
86
81
85
89
84
86
92
72
83
77
84
87
80
89
87
93
88
78
87
81
79
82
82
87
82
81
87
84
80
88
88
93
90
80
85
79
86
87
87
74
86
78
85
80
85
83
88
79
84
95
83
81
88
89
87
91
94
93
83
91...
Pitcher 1
Pitcher 2
87
82
86
92
82
70
84
96
83
89
81
84
85
84
93
80
86
81
85
89
84
86
92
72
83
77
84
87
80
89
87
93
88
78
87
81
79
82
82
87
82
81
87
84
80
88
88
93
90
80
85
79
86
87
87
74
86
78
85
80
85
83
88
79
84
95
83
81
88
89
87
91
94
93
83
91...
Consider the below matrixA, which you can copy and paste directly into Matlab.
Problem #1: Consider the below matrix A, which you can copy and paste directly into Matlab. The matrix contains 3 columns. The first column consists of Test #1 marks, the second column is Test # 2 marks, and the third column is final exam marks for a large linear algebra course. Each row represents a particular student.A = [36 45 75 81 59 73 77 73 73 65 72 78 65 55 83 73 57 78 84 31 60 83...
3.3 Table 3.10 shows the scores in the final examination F and the scores in two preliminary exam...
 3.3 Table 3.10 shows the scores in the final examination F and the scores in two preliminary examinations P1 and P2 for 22 students in a statistics course. The data can be found in the book's Web site. (a) Fit each of the following models to the data: Model 1 F Bo BiP Model 2 F- Model 3 : F-k) + AP,+AP, + ε Table 3.10 Examination Data: Scores in the Final (F), First Preliminary (Pi), and Second Preliminary (P2)...
Chapter 13 Data Set 3 contains the average sales for five stores across four seasons. Which season was the best of all f...
 Chapter 13 Data Set 3 contains the average sales for five stores
across four seasons. Which season was the best of all for
sales?
Figure 13.3 Data for a Single-Factor Analysis of Variance A C Group 1 Group 2 Group 3 (5 hours) (10 Hours) (20 Hours) 1 87 87 89 3 86 85 91 76 99 96 56 85 87 78 79 89 7 98 81 90 77 82 89 66 78 96 10 75 85 96 11 67...
Chapter 13 Data Set 3 contains the average sales for five stores
across four seasons. Which season was the best of all for
sales?
Figure 13.3 Data for a Single-Factor Analysis of Variance A C Group 1 Group 2 Group 3 (5 hours) (10 Hours) (20 Hours) 1 87 87 89 3 86 85 91 76 99 96 56 85 87 78 79 89 7 98 81 90 77 82 89 66 78 96 10 75 85 96 11 67...
Student stress at final exam time comes partly from the uncertainty of grades and the consequence...
 Student stress at final exam time comes partly from the
uncertainty of grades and the consequences of those grades. Can
knowledge of a midterm grade be used to predict a final exam grade?
A random sample of 200 BCOM students from recent years was taken
and their percentage grades on assignments, midterm exam, and final
exam were recorded. Let’s examine the ability of midterm and
assignment grades to predict final exam grades.
The data are shown here:
Assignment
Midterm
FinalExam...
Student stress at final exam time comes partly from the
uncertainty of grades and the consequences of those grades. Can
knowledge of a midterm grade be used to predict a final exam grade?
A random sample of 200 BCOM students from recent years was taken
and their percentage grades on assignments, midterm exam, and final
exam were recorded. Let’s examine the ability of midterm and
assignment grades to predict final exam grades.
The data are shown here:
Assignment
Midterm
FinalExam...
1. Forecast demand for Year 4. a. Explain what technique you utilized to forecast your demand....
 1. Forecast demand for Year 4.
a. Explain what technique you utilized to forecast your
demand.
b. Explain why you chose this technique over others.
Year 3 Year 1 Year 2 Actual Actual Actual Forecast Forecast Forecast Demand Demand Demand Week 1 52 57 63 55 66 77 Week 2 49 58 68 69 75 65 Week 3 47 50 58 65 80 74 Week 4 60 53 58 55 78 67 57 Week 5 49 57 64 76 77...
1. Forecast demand for Year 4.
a. Explain what technique you utilized to forecast your
demand.
b. Explain why you chose this technique over others.
Year 3 Year 1 Year 2 Actual Actual Actual Forecast Forecast Forecast Demand Demand Demand Week 1 52 57 63 55 66 77 Week 2 49 58 68 69 75 65 Week 3 47 50 58 65 80 74 Week 4 60 53 58 55 78 67 57 Week 5 49 57 64 76 77...
Midterm1 = (83.33, 98.33, 75, 91.67, 96.67, 95, 86.67, 65, 100, 100, 80, 88.33, 96.67, 96.67,...
 Midterm1 = (83.33, 98.33, 75, 91.67, 96.67, 95, 86.67, 65, 100,
100, 80, 88.33,
96.67, 96.67, 90, 96.67, 86.67, 93.33, 80, 91.67, 98.33, 86.67, 85,
86.67, 95,
83.33, 96.67, 81.67, 98.33, 100, 95, 93.33, 91.67, 88.33, 98.33,
93.33, 98.33,
93.33, 85, 88.33, 100, 98.33, 96.67, 90, 86.67, 100, 96.67, 98.33,
90, 96.67,
86.67, 95, 78.33, 86.67, 100, 81.67, 96.67, 91.67, 96.67, 96.67,
95, 96.67, 73.33,
100, 93.33, 96.67, 88.33, 70, 96.67, 96.67, 100, 88.33, 96.67, 100,
88.33, 100,
78.33, 93.33,...
Midterm1 = (83.33, 98.33, 75, 91.67, 96.67, 95, 86.67, 65, 100,
100, 80, 88.33,
96.67, 96.67, 90, 96.67, 86.67, 93.33, 80, 91.67, 98.33, 86.67, 85,
86.67, 95,
83.33, 96.67, 81.67, 98.33, 100, 95, 93.33, 91.67, 88.33, 98.33,
93.33, 98.33,
93.33, 85, 88.33, 100, 98.33, 96.67, 90, 86.67, 100, 96.67, 98.33,
90, 96.67,
86.67, 95, 78.33, 86.67, 100, 81.67, 96.67, 91.67, 96.67, 96.67,
95, 96.67, 73.33,
100, 93.33, 96.67, 88.33, 70, 96.67, 96.67, 100, 88.33, 96.67, 100,
88.33, 100,
78.33, 93.33,...
USE R AND SHOW CODES!! The IQ was measured for 35 twins. Is there any difference...
USE R AND SHOW CODES!! The IQ was measured for 35 twins. Is there any difference in IQ between twins? DATA Twin 1 Twin 2 113 109 94 100 99 86 77 80 81 95 91 106 111 117 104 107 85 85 66 84 111 125 51 66 109 108 122 121 97 98 82 94 100 88 100 104 93 84 99 95 109 98 95 100 75 86 104 103 73 78 88 99 92 111 108...
A math test was given to five randomly selected schools. The result of the exams is...
A math test was given to five randomly selected schools. The result of the exams is given in the following table. School 1: 72 83 92 97 82 75 68 93 School 2: 75 81 95 92 88 70 70 90 97 84 76 School 3: 82 73 99 90 66 77 School 4: 71 85 91 95 89 73 70 96 92 83 71 58 63 89 School 5: 82 85 79 90 86 77 71 86 90 73...
 Pitcher 1
Pitcher 2
87
82
86
92
82
70
84
96
83
89
81
84
85
84
93
80
86
81
85
89
84
86
92
72
83
77
84
87
80
89
87
93
88
78
87
81
79
82
82
87
82
81
87
84
80
88
88
93
90
80
85
79
86
87
87
74
86
78
85
80
85
83
88
79
84
95
83
81
88
89
87
91
94
93
83
91...
Pitcher 1
Pitcher 2
87
82
86
92
82
70
84
96
83
89
81
84
85
84
93
80
86
81
85
89
84
86
92
72
83
77
84
87
80
89
87
93
88
78
87
81
79
82
82
87
82
81
87
84
80
88
88
93
90
80
85
79
86
87
87
74
86
78
85
80
85
83
88
79
84
95
83
81
88
89
87
91
94
93
83
91...
 3.3 Table 3.10 shows the scores in the final examination F and the scores in two preliminary examinations P1 and P2 for 22 students in a statistics course. The data can be found in the book's Web site. (a) Fit each of the following models to the data: Model 1 F Bo BiP Model 2 F- Model 3 : F-k) + AP,+AP, + ε Table 3.10 Examination Data: Scores in the Final (F), First Preliminary (Pi), and Second Preliminary (P2)...
 Chapter 13 Data Set 3 contains the average sales for five stores
across four seasons. Which season was the best of all for
sales?
Figure 13.3 Data for a Single-Factor Analysis of Variance A C Group 1 Group 2 Group 3 (5 hours) (10 Hours) (20 Hours) 1 87 87 89 3 86 85 91 76 99 96 56 85 87 78 79 89 7 98 81 90 77 82 89 66 78 96 10 75 85 96 11 67...
Chapter 13 Data Set 3 contains the average sales for five stores
across four seasons. Which season was the best of all for
sales?
Figure 13.3 Data for a Single-Factor Analysis of Variance A C Group 1 Group 2 Group 3 (5 hours) (10 Hours) (20 Hours) 1 87 87 89 3 86 85 91 76 99 96 56 85 87 78 79 89 7 98 81 90 77 82 89 66 78 96 10 75 85 96 11 67...
 Student stress at final exam time comes partly from the
uncertainty of grades and the consequences of those grades. Can
knowledge of a midterm grade be used to predict a final exam grade?
A random sample of 200 BCOM students from recent years was taken
and their percentage grades on assignments, midterm exam, and final
exam were recorded. Let’s examine the ability of midterm and
assignment grades to predict final exam grades.
The data are shown here:
Assignment
Midterm
FinalExam...
Student stress at final exam time comes partly from the
uncertainty of grades and the consequences of those grades. Can
knowledge of a midterm grade be used to predict a final exam grade?
A random sample of 200 BCOM students from recent years was taken
and their percentage grades on assignments, midterm exam, and final
exam were recorded. Let’s examine the ability of midterm and
assignment grades to predict final exam grades.
The data are shown here:
Assignment
Midterm
FinalExam...
 1. Forecast demand for Year 4.
a. Explain what technique you utilized to forecast your
demand.
b. Explain why you chose this technique over others.
Year 3 Year 1 Year 2 Actual Actual Actual Forecast Forecast Forecast Demand Demand Demand Week 1 52 57 63 55 66 77 Week 2 49 58 68 69 75 65 Week 3 47 50 58 65 80 74 Week 4 60 53 58 55 78 67 57 Week 5 49 57 64 76 77...
1. Forecast demand for Year 4.
a. Explain what technique you utilized to forecast your
demand.
b. Explain why you chose this technique over others.
Year 3 Year 1 Year 2 Actual Actual Actual Forecast Forecast Forecast Demand Demand Demand Week 1 52 57 63 55 66 77 Week 2 49 58 68 69 75 65 Week 3 47 50 58 65 80 74 Week 4 60 53 58 55 78 67 57 Week 5 49 57 64 76 77...
 Midterm1 = (83.33, 98.33, 75, 91.67, 96.67, 95, 86.67, 65, 100,
100, 80, 88.33,
96.67, 96.67, 90, 96.67, 86.67, 93.33, 80, 91.67, 98.33, 86.67, 85,
86.67, 95,
83.33, 96.67, 81.67, 98.33, 100, 95, 93.33, 91.67, 88.33, 98.33,
93.33, 98.33,
93.33, 85, 88.33, 100, 98.33, 96.67, 90, 86.67, 100, 96.67, 98.33,
90, 96.67,
86.67, 95, 78.33, 86.67, 100, 81.67, 96.67, 91.67, 96.67, 96.67,
95, 96.67, 73.33,
100, 93.33, 96.67, 88.33, 70, 96.67, 96.67, 100, 88.33, 96.67, 100,
88.33, 100,
78.33, 93.33,...
Midterm1 = (83.33, 98.33, 75, 91.67, 96.67, 95, 86.67, 65, 100,
100, 80, 88.33,
96.67, 96.67, 90, 96.67, 86.67, 93.33, 80, 91.67, 98.33, 86.67, 85,
86.67, 95,
83.33, 96.67, 81.67, 98.33, 100, 95, 93.33, 91.67, 88.33, 98.33,
93.33, 98.33,
93.33, 85, 88.33, 100, 98.33, 96.67, 90, 86.67, 100, 96.67, 98.33,
90, 96.67,
86.67, 95, 78.33, 86.67, 100, 81.67, 96.67, 91.67, 96.67, 96.67,
95, 96.67, 73.33,
100, 93.33, 96.67, 88.33, 70, 96.67, 96.67, 100, 88.33, 96.67, 100,
88.33, 100,
78.33, 93.33,...
Most questions answered within 3 hours.
-
Where is the error in this code sequence?
String s1 = "Hello";
String s2 = "ello";...
asked 10 months ago -
Financial data for Joel de Paris, Inc., for last year
follow:
Joel de Paris, Inc.
Balance...
asked 10 months ago -
Consider this reaction:
Al2(SO4)3 (aq)+ BaCl3
(aq) Al2Cl6 (aq)- +
3BaSO4(s) . What is the...
asked 10 months ago -
Suppose that Savneet is considering increasing her
recent random sample from 20 car rentals to 40...
asked 10 months ago -
Trucks arrive at an unloading terminal at an average rate of 120
per hour.
Trucks arrive...
asked 10 months ago -
Why are methanol and ethanol completely soluble in water while
octanol is not very little soluble....
asked 10 months ago -
A facilities manager at a university reads in a research report
that the mean amount of...
asked 10 months ago -
When the CuSO4 is rehydrated by adding water to the anhydrous
compound, is this an endothermic...
asked 10 months ago -
A ray of sunlight is passing from diamond into crown glass; the
angle of incidence is...
asked 10 months ago -
A block of mass 0.249 kg is placed on top of a light, vertical
spring of...
asked 10 months ago -
how do the kidneys compensate in the presences of acidosis
a) trigger hyperventilate
b) reserve acid...
asked 10 months ago -
Question 501 pts
The rental rate of capital to the firm increases. Which of the
following...
asked 10 months ago