
Homework Answers


I will provide R codes also
x=c(2,3,4,4,5,5,7)
> y=c(6,6,8,9,9,13,15)
> x
[1] 2 3 4 4 5 5 7
> y
[1] 6 6 8 9 9 13 15
> model=lm(y~x)
> model
Call:
lm(formula = y ~ x)
Coefficients:
(Intercept) x
1.056 1.954
> summary(model)
Call:
lm(formula = y ~ x)
Residuals:
1 2 3 4 5 6 7
1.0370 -0.9167 -0.8704 0.1296 -1.8241 2.1759 0.2685
Coefficients:
Estimate Std. Error t value Pr(>|t|)
(Intercept) 1.0556 1.6989 0.621 0.56163
x 1.9537 0.3746 5.216 0.00342 **
---
Signif. codes: 0 ‘***’ 0.001 ‘**’ 0.01 ‘*’ 0.05 ‘.’ 0.1 ‘ ’ 1
Residual standard error: 1.471 on 5 degrees of freedom
Multiple R-squared: 0.8447, Adjusted R-squared: 0.8137
F-statistic: 27.2 on 1 and 5 DF, p-value: 0.003422
cor(x,y)
[1] 0.9190956
Add Answer to:
A
study analyzing the relationship between the age in years of
particular species of fish and...
A study analyzing the relationship between the age in years of a particular species of fish...
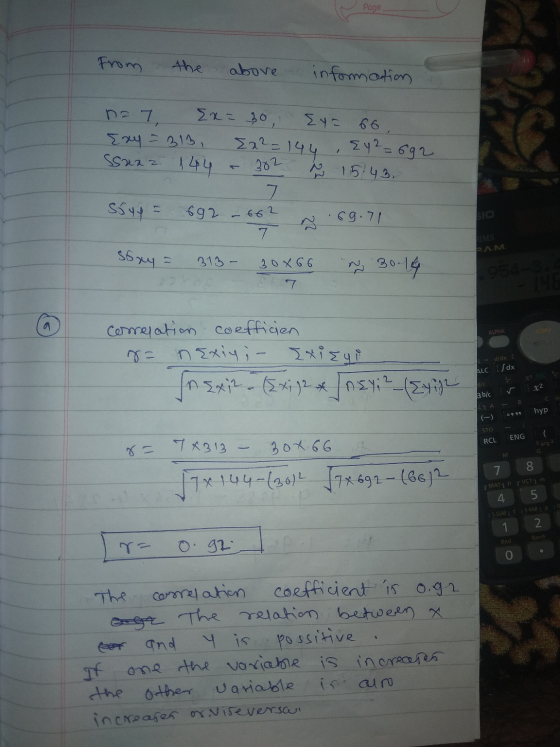
 A study analyzing the relationship between the age in years of a particular species of fish and its weight in pounds produces the following data set: xage 2 3 4 4 5 5 7 (years) y: weight (pounds) 6 6 8 9 2 13 15 The summary data for the study is: n=7. Ex = 30, y = 66, Exy = 313, 3x? - 144, 2y2 = 692, SSX – 15.43, SSxy - 30.14, SSyy = 69.71, Slope of regression...
A study was conducted into the relationship between the age in years of a person and...
A study was conducted into the relationship between the age in years of a person and their average weekly after tax income. You have been supplied with the following information regarding a regression model that had been developed as part of the study. Regression analysis sample intercept 646.58 sample slope 3.42 A particular observed value from the data is: x = 41, y = 825.24 Calculate the residual of this observed value of the response variable. Give your answer to...
A study examines the relationship between years of educational preparation, language spoken, age, primary nursing role,...
A study examines the relationship between years of educational preparation, language spoken, age, primary nursing role, race, and ethnicity, and total score on a cultural competency test among a group of 987 randomly selected nurses at your hospital. What test would be appropriate to determine if there is an association? Answers can include Independent t-test, multiple regression, ANOVA, or Pearson's Correlation.
2. A study of the relationship between age and blood pressure yielded the following data Blood Pressure (Y 126 131 161 128 1489 140 148 Test using a significance level of 5% whether there is an...
 2. A study of the relationship between age and blood pressure yielded the following data Blood Pressure (Y 126 131 161 128 1489 140 148 Test using a significance level of 5% whether there is an increasing linear relationship Age(X) 23 27 45 3 536 37 37 a. between age and blood pressure. Parameter: A- slope of regression line for blood pressure vs.age. Hypotheses: Test Statistic: t.A-A d.f- with the same variance. Rejection Region: Calculated Test: Conclusion P-value. b. Find...
A.) This is a small set of data provided to investigate the relationship between the age...
A.) This is a small set of data provided to investigate the relationship between the age of a lab computer and the number of service calls on it for the school year. Computer output for these data follows. The following data was reported X Age of lab computer 1 1 2 2 2 3 3 3 3 4 5 5 Y Number of repair calls 1 0 2 0 3 1 3 2 5 3 5 4 The regression equation...
A small study is conducted involving 10 infants to investigate the association between gestational age at...
 A small study is conducted involving 10 infants to investigate the association between gestational age at birth, measured in weeks, and birth weight, measured in grams.: Cured Not Cured Drug 1 37 13 Drug 2 88 21 Total 125 34 Total 50 109 159 Table 1: Gestational age: 34.7, 36, 29.3, 40.1, 35.9, 40.8, 38.3, 37, 41.2, 39.8. Birth weight: 1895, 2030, 1440, 2835, 3115, 4013, 3174, 3625, 2289, 2845. . Find the correlation coefficient r of the gestational age...
A Regression methods were used to analyze the data from a study investigating the relationship between...
A Regression methods were used to analyze the data from a study investigating the relationship between the ewe’s weight at time of mating, x (in kg), and her lamb’s offspring 7 months after birth, y (in kg). Summary quantities were n = 20 and x y mean 52 28 Standard deviation 3.96 3.92 Correlation between y and x .548 (a). Calculate the least squares estimates of the slope and intercept. (b). Use the equation of the fitted line to predict...
A company manager is interested in analyzing the relationship between years of working experience and the...
 A company manager is interested in analyzing the relationship between years of working experience and the salary of their employees. He has collected the data from 30 employees of their years of experience and the salary. Below provided is a partial regression output from R. Use the provided information to answer below questions Coefficients: (Intercept) YearsExperience Estimate Std. Error t value Pr(>ltl) 25792.2 2273.1 9450.0 --- Signif. codes: O '***' 0.001 '**' 0.01 '*' 0.05 '.' 0.1'' 1 Analysis of...
What is the relationship between the number of minutes per day a woman spends talking on...
 What is the relationship between the number of minutes per day a woman spends talking on the phone and the woman's weight? The time on the phone and weight for 9 women are shown in the table below. 28 15 Time Pounds 68 149 22 100 64 124 57 143 67 141 101 77 126 68 127 100 0 a. Find the correlation coefficient: r = Round to 2 decimal places. b. The null and alternative hypotheses for correlation are:...
24. (Correlation) A researcher wants to determine if there is a linear relationship between height and...
 24. (Correlation) A researcher wants to determine if there is a linear relationship between height and weight. The following table represents the data collected. Display the data in a scatter plot on your calculator, draw a quick sketch below. Then find the linear regression and put the line of best fit on the sketch. Then state the value for the correlation coefficient and determine if this is significant correlation or no correlation using the table in the back of the...
 A study analyzing the relationship between the age in years of a particular species of fish and its weight in pounds produces the following data set: xage 2 3 4 4 5 5 7 (years) y: weight (pounds) 6 6 8 9 2 13 15 The summary data for the study is: n=7. Ex = 30, y = 66, Exy = 313, 3x? - 144, 2y2 = 692, SSX – 15.43, SSxy - 30.14, SSyy = 69.71, Slope of regression...
 2. A study of the relationship between age and blood pressure yielded the following data Blood Pressure (Y 126 131 161 128 1489 140 148 Test using a significance level of 5% whether there is an increasing linear relationship Age(X) 23 27 45 3 536 37 37 a. between age and blood pressure. Parameter: A- slope of regression line for blood pressure vs.age. Hypotheses: Test Statistic: t.A-A d.f- with the same variance. Rejection Region: Calculated Test: Conclusion P-value. b. Find...
 A small study is conducted involving 10 infants to investigate the association between gestational age at birth, measured in weeks, and birth weight, measured in grams.: Cured Not Cured Drug 1 37 13 Drug 2 88 21 Total 125 34 Total 50 109 159 Table 1: Gestational age: 34.7, 36, 29.3, 40.1, 35.9, 40.8, 38.3, 37, 41.2, 39.8. Birth weight: 1895, 2030, 1440, 2835, 3115, 4013, 3174, 3625, 2289, 2845. . Find the correlation coefficient r of the gestational age...
 A company manager is interested in analyzing the relationship between years of working experience and the salary of their employees. He has collected the data from 30 employees of their years of experience and the salary. Below provided is a partial regression output from R. Use the provided information to answer below questions Coefficients: (Intercept) YearsExperience Estimate Std. Error t value Pr(>ltl) 25792.2 2273.1 9450.0 --- Signif. codes: O '***' 0.001 '**' 0.01 '*' 0.05 '.' 0.1'' 1 Analysis of...
 What is the relationship between the number of minutes per day a woman spends talking on the phone and the woman's weight? The time on the phone and weight for 9 women are shown in the table below. 28 15 Time Pounds 68 149 22 100 64 124 57 143 67 141 101 77 126 68 127 100 0 a. Find the correlation coefficient: r = Round to 2 decimal places. b. The null and alternative hypotheses for correlation are:...
 24. (Correlation) A researcher wants to determine if there is a linear relationship between height and weight. The following table represents the data collected. Display the data in a scatter plot on your calculator, draw a quick sketch below. Then find the linear regression and put the line of best fit on the sketch. Then state the value for the correlation coefficient and determine if this is significant correlation or no correlation using the table in the back of the...
Most questions answered within 3 hours.
-
Where is the error in this code sequence?
String s1 = "Hello";
String s2 = "ello";...
asked 11 months ago -
Financial data for Joel de Paris, Inc., for last year
follow:
Joel de Paris, Inc.
Balance...
asked 11 months ago -
Consider this reaction:
Al2(SO4)3 (aq)+ BaCl3
(aq) Al2Cl6 (aq)- +
3BaSO4(s) . What is the...
asked 11 months ago -
Suppose that Savneet is considering increasing her
recent random sample from 20 car rentals to 40...
asked 11 months ago -
Trucks arrive at an unloading terminal at an average rate of 120
per hour.
Trucks arrive...
asked 11 months ago -
Why are methanol and ethanol completely soluble in water while
octanol is not very little soluble....
asked 11 months ago -
A facilities manager at a university reads in a research report
that the mean amount of...
asked 11 months ago -
When the CuSO4 is rehydrated by adding water to the anhydrous
compound, is this an endothermic...
asked 11 months ago -
A ray of sunlight is passing from diamond into crown glass; the
angle of incidence is...
asked 11 months ago -
A block of mass 0.249 kg is placed on top of a light, vertical
spring of...
asked 11 months ago -
how do the kidneys compensate in the presences of acidosis
a) trigger hyperventilate
b) reserve acid...
asked 11 months ago -
Question 501 pts
The rental rate of capital to the firm increases. Which of the
following...
asked 11 months ago