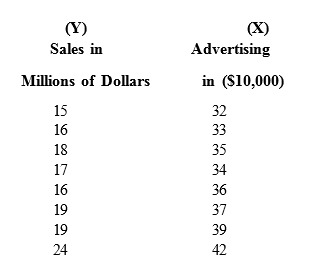
The following data represent a company's yearly sales volume and its advertising expenditure over a period of 8 years.
- Develop a scatter diagram of sales versus advertising and explain what it shows regarding the relationship between sales and advertising. Make sure your axes are labeled and that you have the axes correct (notice that x and y are above the labels). The graph should have a title that mentions the two variables.
- Use the method of least squares to compute an estimated regression line between sales and advertising OR just show it on the graph along with your r-squared value..
- If the company's advertising expenditure is $200,000, what are the predicted sales? Give the answer in dollars. (This is found using algebra and the equation of the trendline / regression line - make sure to watch your units)
- What does the slope of the estimated regression line indicate?
Homework Answers
To develop a scatter diagram of Sales (Y) versus advertising we measure Y (which is called response variable) on the vertical axis and advertising (X) along the horizontal axis. The scatter diagram is shown in the following diagram.

The corresponding observations of Y and X reveals approximately a linear path. therefore, the scatter diagram reveals that a linear relationship between sales and advertising and hence indicating that a linear regression model might be appropriate.

Add Answer to:
The following data
represent a company's yearly sales volume and its advertising
expenditure over a period...
Consider the following sample data for the relationship between advertising budget and sales for Product A:...
Consider the following sample data for the relationship between advertising budget and sales for Product A: Observation 1 2 3 4 5 6 7 8 9 10 Advertising ($) 60,000 70,000 70,000 80,000 80,000 90,000 100,000 100,000 110,000 110,000 Sales ($) 363,000 432,000 417,000 502,000 483,000 537,000 614,000 625,000 653,000 666,000 What is the slope of the "least-squares" best-fit regression line? Please round your answer to the nearest hundredth.
Consider the following sample data for the relationship between advertising budget and sales for Product A:...
Consider the following sample data for the relationship between advertising budget and sales for Product A: Observation 1 2 3 4 5 6 7 8 9 10 Advertising ($) 80000 80000 90000 100000 100000 110000 120000 120000 130000 140000 Sales ($) 499000 477000 546000 614000 623000 653000 747000 714000 785000 858000 What is the slope of the "least-squares" best-fit regression line? Please round your answer to the nearest hundredth.
Consider the following sample data for the relationship between advertising budget and sales for Product A:...
Consider the following sample data for the relationship between advertising budget and sales for Product A: Observation 1 2 3 4 5 6 7 8 9 10 Advertising ($) 90,000 100,000 100,000 110,000 120,000 120,000 130,000 140,000 140,000 150,000 Sales ($) 535,000 626,000 625,000 674,000 712,000 725,000 809,000 832,000 845,000 919,000 What is the slope of the "least-squares" best-fit regression line? Please round your answer to the nearest hundredth. Note that the correct answer will be evaluated based on the...
Consider the following sample data for the relationship between advertising budget and sales for Product A:...
Consider the following sample data for the relationship between advertising budget and sales for Product A: Observation 1 2 3 4 5 6 7 8 9 10 Advertising ($) 30,000 30,000 40,000 50,000 50,000 50,000 60,000 70,000 80,000 80,000 Sales ($) 179,000 183,000 253,000 308,000 301,000 308,000 376,000 418,000 486,000 499,000 What is the slope of the "least-squares" best-fit regression line? Please round your answer to the nearest hundredth. Note that the correct answer will be evaluated based on the...
Consider the following sample data for the relationship between advertising budget and sales for Product A:...
Consider the following sample data for the relationship between advertising budget and sales for Product A: Observation 1 2 3 4 5 6 7 8 9 10 Advertising ($) 70,000 80,000 80,000 90,000 100,000 100,000 110,000 110,000 120,000 130,000 Sales ($) 432,000 478,000 484,000 552,000 605,000 594,000 688,000 674,000 713,000 784,000 What is the slope of the "least-squares" best-fit regression line? Please round your answer to the nearest hundredth. Note that the correct answer will be evaluated based on the...
Consider the following sample data for the relationship between advertising budget and sales for Product A:...
Consider the following sample data for the relationship between advertising budget and sales for Product A: Observation 1 2 3 4 5 6 7 8 9 10 Advertising ($) 40,000 50,000 50,000 60,000 70,000 70,000 80,000 80,000 90,000 100,000 Sales ($) 239,000 315,000 311,000 363,000 432,000 438,000 493,000 486,000 535,000 603,000 What is the slope of the "least-squares" best-fit regression line? Please round your answer to the nearest hundredth. Note that the correct answer will be evaluated based on the...
In cell C6, insert a Scatter Chart for the Returns Completed versus Return Price data from...
 In
cell C6, insert a Scatter Chart for the Returns
Completed versus Return Price data from the Data
worksheet. You may be used to seeing Price placed on the Y-axis
from other economics courses, but in this problem we are using
price as the independent variable.
Inserting Chart
Select the Scatter chart from the provided chart options in the
Charts group of the Insert tab of the Ribbon.
Selecting Data Series
Then choose Select Data in the Design tab on...
In
cell C6, insert a Scatter Chart for the Returns
Completed versus Return Price data from the Data
worksheet. You may be used to seeing Price placed on the Y-axis
from other economics courses, but in this problem we are using
price as the independent variable.
Inserting Chart
Select the Scatter chart from the provided chart options in the
Charts group of the Insert tab of the Ribbon.
Selecting Data Series
Then choose Select Data in the Design tab on...
A recent article in BusinessWeek listed the “Best Small Companies.” We are interested in the relationship between the companies’ sales and earnings. A random sample of 12 companies wasselected and the...
A recent article in BusinessWeek listed the “Best Small Companies.” We are interested in the relationship between the companies’ sales and earnings. A random sample of 12 companies wasselected and the sales and earnings, in millions of dollars, are reported below: Company Papa John’s InternationalApplied Innovation Integracare Wall Data Davidson & AssociatesChico’s FAS Checkmate Electronics Royal Grip M-Wave Serving-N-Slide Daig Cobra Golf Sales ($ millions) $29.2 18.6 18.2 71.7 58.6 46.8 17.5 11.9 19.6 51.2 28.6 69.2 Earnings ($ millions)...
from part 5-12 plz dont do 1-4 BUNUS Assignment! A Sample Data AnalySIS III Licer Please...
 from part 5-12 plz dont do 1-4
BUNUS Assignment! A Sample Data AnalySIS III Licer Please answer all of the following questions. Make sure you show all your work, providing snapshots from Excel as well as listing all formulas and relevant explanation, as needed. We are interested in exploring the relationship between the income of professors (measured in thousands of dollars) and the number of years they have been employed by the university. We collect the following data from eight...
from part 5-12 plz dont do 1-4
BUNUS Assignment! A Sample Data AnalySIS III Licer Please answer all of the following questions. Make sure you show all your work, providing snapshots from Excel as well as listing all formulas and relevant explanation, as needed. We are interested in exploring the relationship between the income of professors (measured in thousands of dollars) and the number of years they have been employed by the university. We collect the following data from eight...
Section 1 Tube [FeSCN^+] M Absorbance 1 0.0005 0.016 2 0.0011 0.0422 3 0.00367 0.0917 4...
Section 1 Tube [FeSCN^+] M Absorbance 1 0.0005 0.016 2 0.0011 0.0422 3 0.00367 0.0917 4 0.00727 0.224 5 0.00965 0.267 6 0.0137 0.398 Part B unknown sol. 0.175 SCENARIO: Five standard solutions containing different known concentrations of an iron (II) thiocyanate (FeSCN+ ) complex are analyzed using spectrophotometry, a technique which measures the quantity of light absorbed by the solution as a function of the concentration of the analyte in solution (in this case, FeSCN+ ). The results of...
 In
cell C6, insert a Scatter Chart for the Returns
Completed versus Return Price data from the Data
worksheet. You may be used to seeing Price placed on the Y-axis
from other economics courses, but in this problem we are using
price as the independent variable.
Inserting Chart
Select the Scatter chart from the provided chart options in the
Charts group of the Insert tab of the Ribbon.
Selecting Data Series
Then choose Select Data in the Design tab on...
In
cell C6, insert a Scatter Chart for the Returns
Completed versus Return Price data from the Data
worksheet. You may be used to seeing Price placed on the Y-axis
from other economics courses, but in this problem we are using
price as the independent variable.
Inserting Chart
Select the Scatter chart from the provided chart options in the
Charts group of the Insert tab of the Ribbon.
Selecting Data Series
Then choose Select Data in the Design tab on...
 from part 5-12 plz dont do 1-4
BUNUS Assignment! A Sample Data AnalySIS III Licer Please answer all of the following questions. Make sure you show all your work, providing snapshots from Excel as well as listing all formulas and relevant explanation, as needed. We are interested in exploring the relationship between the income of professors (measured in thousands of dollars) and the number of years they have been employed by the university. We collect the following data from eight...
from part 5-12 plz dont do 1-4
BUNUS Assignment! A Sample Data AnalySIS III Licer Please answer all of the following questions. Make sure you show all your work, providing snapshots from Excel as well as listing all formulas and relevant explanation, as needed. We are interested in exploring the relationship between the income of professors (measured in thousands of dollars) and the number of years they have been employed by the university. We collect the following data from eight...
Most questions answered within 3 hours.
-
Where is the error in this code sequence?
String s1 = "Hello";
String s2 = "ello";...
asked 10 months ago -
Financial data for Joel de Paris, Inc., for last year
follow:
Joel de Paris, Inc.
Balance...
asked 10 months ago -
Consider this reaction:
Al2(SO4)3 (aq)+ BaCl3
(aq) Al2Cl6 (aq)- +
3BaSO4(s) . What is the...
asked 10 months ago -
Suppose that Savneet is considering increasing her
recent random sample from 20 car rentals to 40...
asked 10 months ago -
Trucks arrive at an unloading terminal at an average rate of 120
per hour.
Trucks arrive...
asked 10 months ago -
Why are methanol and ethanol completely soluble in water while
octanol is not very little soluble....
asked 10 months ago -
A facilities manager at a university reads in a research report
that the mean amount of...
asked 10 months ago -
When the CuSO4 is rehydrated by adding water to the anhydrous
compound, is this an endothermic...
asked 10 months ago -
A ray of sunlight is passing from diamond into crown glass; the
angle of incidence is...
asked 10 months ago -
A block of mass 0.249 kg is placed on top of a light, vertical
spring of...
asked 10 months ago -
how do the kidneys compensate in the presences of acidosis
a) trigger hyperventilate
b) reserve acid...
asked 10 months ago -
Question 501 pts
The rental rate of capital to the firm increases. Which of the
following...
asked 10 months ago