

Homework Answers


Add Answer to:
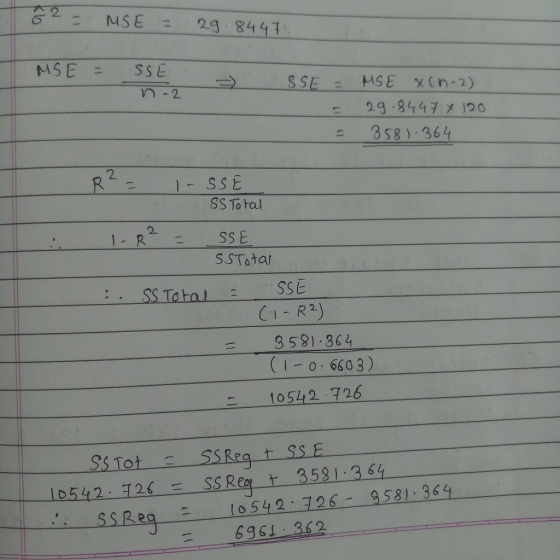
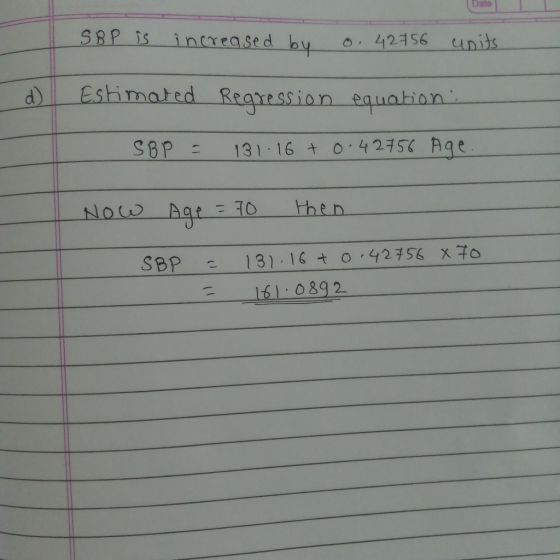
1. (55 points) The investigators are interested in asses the relationship between Systolic Blood Pressure (SBP)...
A study looked at the relationship between alcohol consumption and level of systolic blood pressure (SBP)...
 A study looked at the relationship between alcohol consumption and level of systolic blood pressure (SBP) in women not using oral contraceptives (OC). Alcohol consumption was categorized as follows: no alcohol use; s 10 oz/week alcohol consumption; > 10 oz/week alcohol consumption. The results for the SBP measurements for women 30-39 years of age are given below. Group A. No Alcohol Use B. s 10 oz/week alcohol consumption C. > 10 oz/week alcohol consumption Mean var 105.3 10.6 110.4 13.4...
Consider the dataset in the proj2-3.txt file on BlackBoard. In this problem, focus is on high systolic blood pressure (sbp) and possible explanatory variables Body Mass Index (bmi), and scale (scl)....
Consider the dataset in the proj2-3.txt file on BlackBoard. In this problem, focus is on high systolic blood pressure (sbp) and possible explanatory variables Body Mass Index (bmi), and scale (scl). Consider the linear regression model with response high SBP and scale as explana- tory variables. Explain the coefficients in the model? Explain the null hypotheses that the estimated slope equals 0? Write a summary of your findings. What is your conclusion? Residuals: Min 1Q Median 3Q Max -72.64 -27.55...
(13 points) Suppose you have a simple linear regression model such that Y; = Bo +...
 (13 points) Suppose you have a simple linear regression model such that Y; = Bo + B18: +€4 with and N(0,0%) Call: 1m (formula - y - x) Formula: F=MSR/MSE, R2 = SSR/SSTO ANOVA decomposition: SSTOSSE + SSR Residuals: Min 1Q Modian -2.16313 -0.64507 -0.06586 Max 30 0.62479 3.00517 Coefficients: Estimate Std. Error t value Pr(> It) (Intercept) 8.00967 0.36529 21.93 -0.62009 0.04245 -14.61 <2e-16 ... <2e-16 .. Signif. codes: ****' 0.001 '** 0.01 '* 0.05 0.1'' 1 Residual standard...
Problem. Alex Rodriguez is interested in the relationship between the number of games won by a...
 Problem. Alex Rodriguez is interested in the relationship between the number of games won by a major league baseball team in a season (1) and the team's batting average (x). He collected data and obtained the following ANOVA table for a simple linear regression model, y = 3, +3.x + Mean Square F Significance F Regression Residual df ? 15 ? Sum of Squares 248.0 600.0 348.0 Total (1) What is the sample size n? Select one: 15 16 17...
2. The data set prostate in the faraway package is from a study on 97 men...
 2. The data set prostate in the faraway package is from a study on 97 men with prostate cancer who were due to receive a radical prostatectomy. We are interest is in predicting lpsa (log prostate specific antigen) with lcavol (log cancer volume). (a) Draw a scatterplot - does a simple linear regression model seem reasonable? (b) Without using the R function Im(0, compute the values , Y,Sxx, Syy and Sxy. Com pute the ordinary least squares estimates of the...
To investigate the impact of advertising medias (say youtube) on sales, we construct the fol- lowing...
 To investigate the impact of advertising medias (say youtube) on sales, we construct the fol- lowing simple linear regression model Y; = Bo + B12; + &i with std N(0,0%) where Y is the sales and x is advertising budget in thousands of dollars. The summary table is given below: Formula: Call: 1m (formula = sales youtube, data = marketing) Residuals: Min 1Q Median 3Q Max -10.0632 -2.3454 -0.2295 2.4805 8.6548 F=MSR/MSE, R2 = SSR/SSTO ANOVA decomposition: SSTO = SSE...
5 points QUESTION 19 13)-19) A company analyst is interested in the relationship between number of...
 5 points QUESTION 19 13)-19) A company analyst is interested in the relationship between number of cars sold per month (in 1.000s)) and three independent variables: price per gallon of gasoline (x1=Gas, in $), the prevailing interest rate for car loans (X2=Interest, in %), and the car model (x3=model, with X3-1, if the car is standard, and X3.0, if the car is luxury). He took a sample of 50 observations and obtained the following output: Coefficients Standard Errort Stat P-value...
QUESTION 27 Q27. A manager at a local bank analyzed the relationship between monthly salary (y,...
 QUESTION 27 Q27. A manager at a local bank analyzed the relationship between monthly salary (y, in $) and length of service (x, measured in months) for 30 employees. She estimates the model: Salary = Bo + B1 Service + ε. The following ANOVA table below shows a portion of the regression results. df SS M S F Regression 555,420 555,420 7.64 Residual 27 1,962,873 72,699 Total 28 2 ,518,293 Coefficients Standard Error t-stat p-value Intercept 784.92 322.25 2.44 0.02...
Supermarkets can use the scanning data collected at the checkout counters to evaluate the effect of...
Supermarkets can use the scanning data collected at the checkout counters to evaluate the effect of price on the sales of any product. Weekly data was collected on a particular beverage brand, including sales (in number of units) and price (in dollars). Based on a simple linear regression analysis, the fitted regression equation was: Y = 2259 - 1418 X. The ANOVA F-statistic was 60.52 with the p-value of <0.0001, and R2 = 0.597. According to this model, is the explanatory...
Find the sample variance of the dependent variable yi. What fraction of the sample variance in...
 Find the sample variance of the dependent variable
yi.
What fraction of the sample variance in
yi can be explained by the linear regression
model? Find the coefficient of determination,
r2.
Find the adjusted r2
value.
Do we have enough evidence to conclude that there exists
a strong linear relationship between xi and
yi? Find the p-value for the
test.
Problem. Chris Pratt is almost ready to pop the question to the girl of his dreams. He collected the data...
Find the sample variance of the dependent variable
yi.
What fraction of the sample variance in
yi can be explained by the linear regression
model? Find the coefficient of determination,
r2.
Find the adjusted r2
value.
Do we have enough evidence to conclude that there exists
a strong linear relationship between xi and
yi? Find the p-value for the
test.
Problem. Chris Pratt is almost ready to pop the question to the girl of his dreams. He collected the data...
 A study looked at the relationship between alcohol consumption and level of systolic blood pressure (SBP) in women not using oral contraceptives (OC). Alcohol consumption was categorized as follows: no alcohol use; s 10 oz/week alcohol consumption; > 10 oz/week alcohol consumption. The results for the SBP measurements for women 30-39 years of age are given below. Group A. No Alcohol Use B. s 10 oz/week alcohol consumption C. > 10 oz/week alcohol consumption Mean var 105.3 10.6 110.4 13.4...
 (13 points) Suppose you have a simple linear regression model such that Y; = Bo + B18: +€4 with and N(0,0%) Call: 1m (formula - y - x) Formula: F=MSR/MSE, R2 = SSR/SSTO ANOVA decomposition: SSTOSSE + SSR Residuals: Min 1Q Modian -2.16313 -0.64507 -0.06586 Max 30 0.62479 3.00517 Coefficients: Estimate Std. Error t value Pr(> It) (Intercept) 8.00967 0.36529 21.93 -0.62009 0.04245 -14.61 <2e-16 ... <2e-16 .. Signif. codes: ****' 0.001 '** 0.01 '* 0.05 0.1'' 1 Residual standard...
 Problem. Alex Rodriguez is interested in the relationship between the number of games won by a major league baseball team in a season (1) and the team's batting average (x). He collected data and obtained the following ANOVA table for a simple linear regression model, y = 3, +3.x + Mean Square F Significance F Regression Residual df ? 15 ? Sum of Squares 248.0 600.0 348.0 Total (1) What is the sample size n? Select one: 15 16 17...
 2. The data set prostate in the faraway package is from a study on 97 men with prostate cancer who were due to receive a radical prostatectomy. We are interest is in predicting lpsa (log prostate specific antigen) with lcavol (log cancer volume). (a) Draw a scatterplot - does a simple linear regression model seem reasonable? (b) Without using the R function Im(0, compute the values , Y,Sxx, Syy and Sxy. Com pute the ordinary least squares estimates of the...
 To investigate the impact of advertising medias (say youtube) on sales, we construct the fol- lowing simple linear regression model Y; = Bo + B12; + &i with std N(0,0%) where Y is the sales and x is advertising budget in thousands of dollars. The summary table is given below: Formula: Call: 1m (formula = sales youtube, data = marketing) Residuals: Min 1Q Median 3Q Max -10.0632 -2.3454 -0.2295 2.4805 8.6548 F=MSR/MSE, R2 = SSR/SSTO ANOVA decomposition: SSTO = SSE...
 5 points QUESTION 19 13)-19) A company analyst is interested in the relationship between number of cars sold per month (in 1.000s)) and three independent variables: price per gallon of gasoline (x1=Gas, in $), the prevailing interest rate for car loans (X2=Interest, in %), and the car model (x3=model, with X3-1, if the car is standard, and X3.0, if the car is luxury). He took a sample of 50 observations and obtained the following output: Coefficients Standard Errort Stat P-value...
 QUESTION 27 Q27. A manager at a local bank analyzed the relationship between monthly salary (y, in $) and length of service (x, measured in months) for 30 employees. She estimates the model: Salary = Bo + B1 Service + ε. The following ANOVA table below shows a portion of the regression results. df SS M S F Regression 555,420 555,420 7.64 Residual 27 1,962,873 72,699 Total 28 2 ,518,293 Coefficients Standard Error t-stat p-value Intercept 784.92 322.25 2.44 0.02...
 Find the sample variance of the dependent variable
yi.
What fraction of the sample variance in
yi can be explained by the linear regression
model? Find the coefficient of determination,
r2.
Find the adjusted r2
value.
Do we have enough evidence to conclude that there exists
a strong linear relationship between xi and
yi? Find the p-value for the
test.
Problem. Chris Pratt is almost ready to pop the question to the girl of his dreams. He collected the data...
Find the sample variance of the dependent variable
yi.
What fraction of the sample variance in
yi can be explained by the linear regression
model? Find the coefficient of determination,
r2.
Find the adjusted r2
value.
Do we have enough evidence to conclude that there exists
a strong linear relationship between xi and
yi? Find the p-value for the
test.
Problem. Chris Pratt is almost ready to pop the question to the girl of his dreams. He collected the data...
Most questions answered within 3 hours.
-
Where is the error in this code sequence?
String s1 = "Hello";
String s2 = "ello";...
asked 10 months ago -
Financial data for Joel de Paris, Inc., for last year
follow:
Joel de Paris, Inc.
Balance...
asked 10 months ago -
Consider this reaction:
Al2(SO4)3 (aq)+ BaCl3
(aq) Al2Cl6 (aq)- +
3BaSO4(s) . What is the...
asked 10 months ago -
Suppose that Savneet is considering increasing her
recent random sample from 20 car rentals to 40...
asked 10 months ago -
Trucks arrive at an unloading terminal at an average rate of 120
per hour.
Trucks arrive...
asked 10 months ago -
Why are methanol and ethanol completely soluble in water while
octanol is not very little soluble....
asked 10 months ago -
A facilities manager at a university reads in a research report
that the mean amount of...
asked 10 months ago -
When the CuSO4 is rehydrated by adding water to the anhydrous
compound, is this an endothermic...
asked 10 months ago -
A ray of sunlight is passing from diamond into crown glass; the
angle of incidence is...
asked 10 months ago -
A block of mass 0.249 kg is placed on top of a light, vertical
spring of...
asked 10 months ago -
how do the kidneys compensate in the presences of acidosis
a) trigger hyperventilate
b) reserve acid...
asked 10 months ago -
Question 501 pts
The rental rate of capital to the firm increases. Which of the
following...
asked 10 months ago