Make Power Point 7 slides on the below topic. Highlight the role of regression analysis with...
Make Power Point 7 slides on the below topic.
Highlight the role of regression analysis with the help of a small dataset and interpret the results thereof.
Homework Answers


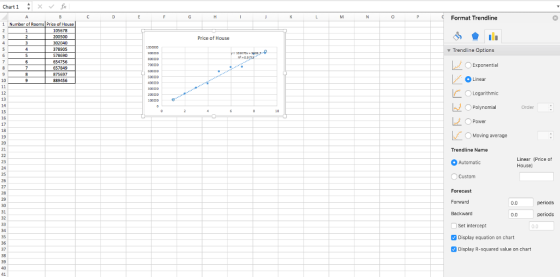

The regression equation shows that 97 % of the price of the house can be explained by the presence of the number of rooms in the house.
Add Answer to:
Make Power Point 7 slides on the below
topic.
Highlight the role of regression analysis with...
Make Power Point 7 slides on the below topic. Use of Computers for Speedy Simulations.
Make Power Point 7 slides on the below topic. Use of Computers for Speedy Simulations.
POWER- POINT PRESENTATION 25 Slides or more PRESENTATION Topic: Fat Won't Make You Fat: Importance of...
POWER- POINT PRESENTATION 25 Slides or more PRESENTATION Topic: Fat Won't Make You Fat: Importance of Healthy Fat.
POWER POINT PRESENTATION 25 slides or more TOPIC: Health, Safety, and Nutrition
POWER POINT PRESENTATION 25 slides or more TOPIC: Health, Safety, and Nutrition
POWER -POINT PRESENTATION 25 SLIDES OR MORE PRESENTATION TOPIC: Health, Safety, and Nutrition
POWER -POINT PRESENTATION 25 SLIDES OR MORE PRESENTATION TOPIC: Health, Safety, and Nutrition
POWER-POINT PRESENTATION TOPIC; Fat Won't Make You Fat: Importance of Healthy Fat.
POWER-POINT PRESENTATION TOPIC; Fat Won't Make You Fat: Importance of Healthy Fat.
power-point presentation Topic : Fat Won't Make You Fat: Importance of Healthy Fat.
power-point presentation Topic : Fat Won't Make You Fat: Importance of Healthy Fat.
power-point presentation Topic Fat Won't Make You Fat: Importance of Healthy Fat.
power-point presentation Topic Fat Won't Make You Fat: Importance of Healthy Fat.
Please make a professional power point presentation Topic: Sustainable Marketing Slide 01: Introduction Slide 02: Provide...
Please make a professional power point presentation Topic: Sustainable Marketing Slide 01: Introduction Slide 02: Provide Examples of Companies pursuing this / challenges faced (2 short example of companies) Slide 03: Do you think this is an effective tool? why or why not . Note: i need just 3 slide but professional presentation on the above topic with the slide points
1. Complete a full regression analysis of the student data below: Student Math Placement Calculus Sketch...
 1. Complete a full regression analysis of the student data below: Student Math Placement Calculus Sketch the Scatterplot Test Grade sketch and interpret the residual plot 1 39 65 write the regression equation 2 43 78 interpret the regression coefficient 21 52 interpret the correlation coefficient and 64 82 coefficient of determination. 5 57 92 6 47 89 7 28 73 8 75 98 What is the predicted grade of a student who scores a "60" on the placement test?...
A multiple regression analysis between yearly income (Y in $1,000s), college grade point average (X1), age...
A multiple regression analysis between yearly income (Y in $1,000s), college grade point average (X1), age of the individuals (X2), and the gender of the individual (X3; zero representing female and one representing male) was performed on a sample of 10 people, and the following results were obtained. Coefficient Standard Error Constant 4.0928 1.4400 X1 10.0230 1.6512 X2 0.1020 0.1225 X3 -4.4811 1.4400 Analysis of Variance Source DoF SoS MS F Regression ? 360.59...
 1. Complete a full regression analysis of the student data below: Student Math Placement Calculus Sketch the Scatterplot Test Grade sketch and interpret the residual plot 1 39 65 write the regression equation 2 43 78 interpret the regression coefficient 21 52 interpret the correlation coefficient and 64 82 coefficient of determination. 5 57 92 6 47 89 7 28 73 8 75 98 What is the predicted grade of a student who scores a "60" on the placement test?...
Most questions answered within 3 hours.
-
Where is the error in this code sequence?
String s1 = "Hello";
String s2 = "ello";...
asked 10 months ago -
Financial data for Joel de Paris, Inc., for last year
follow:
Joel de Paris, Inc.
Balance...
asked 10 months ago -
Consider this reaction:
Al2(SO4)3 (aq)+ BaCl3
(aq) Al2Cl6 (aq)- +
3BaSO4(s) . What is the...
asked 10 months ago -
Suppose that Savneet is considering increasing her
recent random sample from 20 car rentals to 40...
asked 10 months ago -
Trucks arrive at an unloading terminal at an average rate of 120
per hour.
Trucks arrive...
asked 10 months ago -
Why are methanol and ethanol completely soluble in water while
octanol is not very little soluble....
asked 10 months ago -
A facilities manager at a university reads in a research report
that the mean amount of...
asked 10 months ago -
When the CuSO4 is rehydrated by adding water to the anhydrous
compound, is this an endothermic...
asked 10 months ago -
A ray of sunlight is passing from diamond into crown glass; the
angle of incidence is...
asked 10 months ago -
A block of mass 0.249 kg is placed on top of a light, vertical
spring of...
asked 10 months ago -
how do the kidneys compensate in the presences of acidosis
a) trigger hyperventilate
b) reserve acid...
asked 10 months ago -
Question 501 pts
The rental rate of capital to the firm increases. Which of the
following...
asked 10 months ago