
Homework Answers
Periodic return of stock = (Final price – Initial price + Dividend)/ Initial price
Return in May = ($ 161.33 - $ 164.43)/ $ 164.43
= - $ 3.1 /$ 164.43
= -0.018853007 or - 1.89 %
Return in June = ($ 173.55 - $ 161.33)/ $ 161.33
= $ 12.22 /$ 161.33
= 0.075745367 or 7.57 %
Add Answer to:
calculate the return of stock X in May and June
6. The prices of Stock X...
A stock technical analyst uses smoothing methods to predict stock prices. The following table contains the...
A stock technical analyst uses smoothing methods to predict stock prices. The following table contains the monthly price information for Walmart. Date Price 11/30/2018 95.62 12/31/2018 91.71 1/31/2019 94.35 2/28/2019 97.46 3/29/2019 96.54 4/30/2019 101.80 5/31/2019 100.94 6/28/2019 109.95 7/31/2019 109.84 8/30/2019 114.26 9/30/2019 118.68 10/31/2019 117.26 What is the predicted share price for August 30, 2019 if this technical analyst uses an exponential smoothing method with a smoothing constant of .7 and a 5-month moving average as the initial...
A stock technical analyst uses smoothing methods to predict stock prices. The following table contains the monthly price...
A stock technical analyst uses smoothing methods to predict stock prices. The following table contains the monthly price information for Walmart. Date Price 11/30/2018 95.62 12/31/2018 91.71 1/31/2019 94.35 2/28/2019 97.46 3/29/2019 96.54 4/30/2019 101.80 5/31/2019 100.94 6/28/2019 109.95 7/31/2019 109.84 8/30/2019 114.26 9/30/2019 118.68 10/31/2019 117.26 What is the predicted share price for October 31, 2019 if this technical analyst uses a 5-month moving average method?
A stock technical analyst uses smoothing methods to predict stock prices. The following table contains the...
A stock technical analyst uses smoothing methods to predict stock prices. The following table contains the monthly price information for Walmart. Date Price 11/30/2018 95.62 12/31/2018 91.71 1/31/2019 94.35 2/28/2019 97.46 3/29/2019 96.54 4/30/2019 101.80 5/31/2019 100.94 6/28/2019 109.95 7/31/2019 109.84 8/30/2019 114.26 9/30/2019 118.68 10/31/2019 117.26 What is the predicted share price for October 31, 2019 if this technical analyst uses a 5-month moving average method? A. $107.36 B. $114.00 C. $110.73 D. $109.24
A stock technical analyst uses smoothing methods to predict stock prices. The following table contains the...
A stock technical analyst uses smoothing methods to predict stock prices. The following table contains the monthly price information for Walmart. Date Price 11/30/2018 95.62 12/31/2018 91.71 1/31/2019 94.35 2/28/2019 97.46 3/29/2019 96.54 4/30/2019 101.80 5/31/2019 100.94 6/28/2019 109.95 7/31/2019 109.84 8/30/2019 114.26 9/30/2019 118.68 10/31/2019 117.26 What is the predicted share price for August 30, 2019 if this technical analyst uses an exponential smoothing method with a smoothing constant of .7 and a 5-month moving average as the initial...
Dividend Using the data in the table, calculate the return for investing in the stock from...
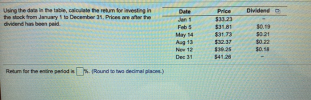 Dividend Using the data in the table, calculate the return for investing in the stock from January 1 to December 31. Prices are after the Price Date $33.23 Jan 1 dividend has been paid. $0.19 $31.81 Feb 5 May 14 Aug 13 Nov 12 $0.21 $31.73 $32.37 $0.22 $0.18 $39.25 $41.26 Dec 31 Return for the entire period is %. (Round to two decimal places.)
Calculate the monthly return of the stocks of Amazon and Walmart, each, from Jan 4, 2010 to June 4, 2019. (Yahoo Financ...
 Calculate the monthly return of the stocks of Amazon and Walmart, each, from Jan 4, 2010 to June 4, 2019. (Yahoo Finance provides monthly returns! Use the prices given under "adjusted close") 1. What is the monthly expected return and the standard deviation of a portfolio that is composed of a) 10% Amazon, 90% Walmart? b) 20% Amazon, 80% Walmart? c) d) 40% Amazon, 60% Walmart? e) 50% Amazon, 50% Walmart? 30% Amazon, 70% Walmart? 60% Amazon, 40% Walmart? g)...
Using the data from the following table. . calculate the return for investing in this stock...
 Using the data from the following table. . calculate the return for investing in this stock from January 1 to December 31 Prices are after the dividend has been paid. The return from January 1 to March 31 is . (Round to five decimal places.) The return from March 31 to June 30 is . (Round to five decimal places.) The return from June 30 to September 30 is . (Round to five decimal places.) The return from September 30...
Requirements 1 In cell D17, by using cell references, calculate the return of the stock during...
 Requirements
1
In cell D17, by using cell references, calculate
the return of the stock during the period Jan-1 to Feb-5 (1
pt.).
2
In cell D18, by using cell references, calculate
the return of the stock during the period Feb-5 to May-14
(1 pt.).
3
In cell D19, by using cell references, calculate
the return of the stock during the period May-14 to Aug-13
(1 pt.).
4
In cell D20, by using cell references, calculate
the return of the...
Requirements
1
In cell D17, by using cell references, calculate
the return of the stock during the period Jan-1 to Feb-5 (1
pt.).
2
In cell D18, by using cell references, calculate
the return of the stock during the period Feb-5 to May-14
(1 pt.).
3
In cell D19, by using cell references, calculate
the return of the stock during the period May-14 to Aug-13
(1 pt.).
4
In cell D20, by using cell references, calculate
the return of the...
6. Using the data in the table to the right, calculate the return for investing in...
6. Using the data in the table to the right, calculate the return for investing in the stock from January 1 to December 31. Prices are after the dividend has been paid. Date Price Dividend 1/2/03 $32.64 - 2/5/03 $31.49 $0.22 5/14/03 $30.76 $0.18 8/13/03 $32.66 $0.22 11/12/03 $38.52 $0.19 1/2/04 $43.88 - Return for the entire period is __ (Round to two decimal places.) 7. You observe a portfolio for five years and determine that its average return is...
Using the data in the table to the right, calculate the return for investing in the...
 Using the data in the table to the right, calculate the return for investing in the stock from January 1 to December 31. Prices are after the dividend has been paid. Date Dividend Price Jan 1 $32.19 Feb 5 $29.52 $31.01 $0.22 May 14 $0.17 Aug 13 Nov 12 $0.22 $32.14 $39.63 $0.18 Dec 31 $41.58 Return for the entire period is %. (Round to two decimal places.)
 Dividend Using the data in the table, calculate the return for investing in the stock from January 1 to December 31. Prices are after the Price Date $33.23 Jan 1 dividend has been paid. $0.19 $31.81 Feb 5 May 14 Aug 13 Nov 12 $0.21 $31.73 $32.37 $0.22 $0.18 $39.25 $41.26 Dec 31 Return for the entire period is %. (Round to two decimal places.)
 Calculate the monthly return of the stocks of Amazon and Walmart, each, from Jan 4, 2010 to June 4, 2019. (Yahoo Finance provides monthly returns! Use the prices given under "adjusted close") 1. What is the monthly expected return and the standard deviation of a portfolio that is composed of a) 10% Amazon, 90% Walmart? b) 20% Amazon, 80% Walmart? c) d) 40% Amazon, 60% Walmart? e) 50% Amazon, 50% Walmart? 30% Amazon, 70% Walmart? 60% Amazon, 40% Walmart? g)...
 Using the data from the following table. . calculate the return for investing in this stock from January 1 to December 31 Prices are after the dividend has been paid. The return from January 1 to March 31 is . (Round to five decimal places.) The return from March 31 to June 30 is . (Round to five decimal places.) The return from June 30 to September 30 is . (Round to five decimal places.) The return from September 30...
 Requirements
1
In cell D17, by using cell references, calculate
the return of the stock during the period Jan-1 to Feb-5 (1
pt.).
2
In cell D18, by using cell references, calculate
the return of the stock during the period Feb-5 to May-14
(1 pt.).
3
In cell D19, by using cell references, calculate
the return of the stock during the period May-14 to Aug-13
(1 pt.).
4
In cell D20, by using cell references, calculate
the return of the...
Requirements
1
In cell D17, by using cell references, calculate
the return of the stock during the period Jan-1 to Feb-5 (1
pt.).
2
In cell D18, by using cell references, calculate
the return of the stock during the period Feb-5 to May-14
(1 pt.).
3
In cell D19, by using cell references, calculate
the return of the stock during the period May-14 to Aug-13
(1 pt.).
4
In cell D20, by using cell references, calculate
the return of the...
 Using the data in the table to the right, calculate the return for investing in the stock from January 1 to December 31. Prices are after the dividend has been paid. Date Dividend Price Jan 1 $32.19 Feb 5 $29.52 $31.01 $0.22 May 14 $0.17 Aug 13 Nov 12 $0.22 $32.14 $39.63 $0.18 Dec 31 $41.58 Return for the entire period is %. (Round to two decimal places.)
Most questions answered within 3 hours.
-
Where is the error in this code sequence?
String s1 = "Hello";
String s2 = "ello";...
asked 11 months ago -
Financial data for Joel de Paris, Inc., for last year
follow:
Joel de Paris, Inc.
Balance...
asked 11 months ago -
Consider this reaction:
Al2(SO4)3 (aq)+ BaCl3
(aq) Al2Cl6 (aq)- +
3BaSO4(s) . What is the...
asked 11 months ago -
Suppose that Savneet is considering increasing her
recent random sample from 20 car rentals to 40...
asked 11 months ago -
Trucks arrive at an unloading terminal at an average rate of 120
per hour.
Trucks arrive...
asked 11 months ago -
Why are methanol and ethanol completely soluble in water while
octanol is not very little soluble....
asked 11 months ago -
A facilities manager at a university reads in a research report
that the mean amount of...
asked 11 months ago -
When the CuSO4 is rehydrated by adding water to the anhydrous
compound, is this an endothermic...
asked 11 months ago -
A ray of sunlight is passing from diamond into crown glass; the
angle of incidence is...
asked 11 months ago -
A block of mass 0.249 kg is placed on top of a light, vertical
spring of...
asked 11 months ago -
how do the kidneys compensate in the presences of acidosis
a) trigger hyperventilate
b) reserve acid...
asked 11 months ago -
Question 501 pts
The rental rate of capital to the firm increases. Which of the
following...
asked 11 months ago