Homework Answers

Add Answer to:
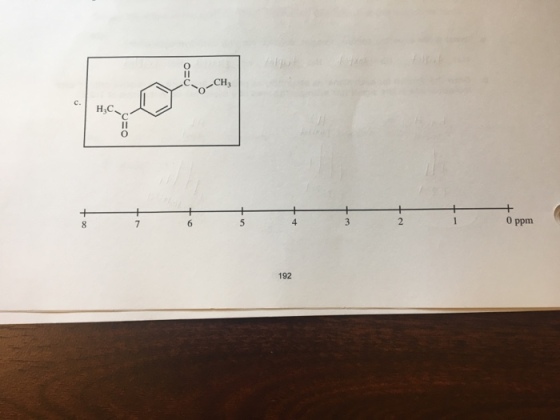
Draw the expected H NMR spectrum for each molecule. Pay
attention to the chemical shift and...
Draw a H NMR spectrum for each compound. Pay attention to the chemical shift (ppm) multiplicity,...
 Draw a H NMR spectrum for each compound. Pay attention to the chemical shift (ppm) multiplicity, and integration of each peak. The boxes indicate where the peaks should go (which ppm range) as well as the relative height of each peak OH PPM O 3 PPM -2. H 10 8 PPM
Part 2: Draw the NMR spectrum: Draw the structure of your molecule below, indicating each unique...
 Part 2: Draw the NMR spectrum: Draw the structure of your molecule below, indicating each unique hydrogen atom with letters, starting with A. After complete the below table, summarizing the integration, approximate chemical shift, number of neighbors, and splitting pattern of each hydrogen in your given molecule. Note, you do not need to fill every row in the below table. By CH₃ Structures H₂C- 2 Brono- 4 methyl pertane Hydrogen Integration Letter A Chemical Number of Splitting Pattern Shift Neighbors...
n-Butanol ОН Part 2: Draw the NMR spectrum Draw the structure of your molecule below, indicating...
 n-Butanol ОН Part 2: Draw the NMR spectrum Draw the structure of your molecule below, indicating each unique hydrogen atom with letters, starting with A. After complete the below table, summarizing the integration, approximate chemical shift number of neighbors, and splitting pattern of each hydrogen in your given molecule. Note, you do not need to fill every row in the below table. Structure: Hydrogen Integration Letter Chemical Number of Splitting Pattern Shift Neighbors Now, draw the NMR in the space...
Predicting the Spectrum MR and C NMR) the expected 'H NMR number of si spectrum for...
 Predicting the Spectrum MR and C NMR) the expected 'H NMR number of si spectrum for the following molecule. Be sure to include appropriate for the following molecule. Be sure to er of signals, show spisina ar try to indicate relative Integration by arca un (label peak with some splitting and try to indicate relative Integration by area under peak peak with correct number for clarity in tabel all the unique hydrogens with letters and assign them to the peaks...
4. Draw a clear and accurate NMR spectrum for the molecule shown below. Clearly show the...
 4. Draw a clear and accurate NMR spectrum for the molecule shown below. Clearly show the number of peaks, and the integration, chemical shift and splitting of each peak. PP 5. Use the chemspider.com to look up the NMR spectrum for the compound in 4. Compare that spectrum to your answer in 4. Draw that spectrum here, explaining the differences between the actual spectrum and what you predicted. Don't worry if you what you initially drew was incorect PPM
For each peak of the NMR, describe the chemical shift, functional group, integration, splitting pattern, neighbors,...
 For each peak of the NMR, describe the chemical shift,
functional group, integration, splitting pattern, neighbors, the
molecule that the peak represents, and finally draw the final
structure of the NMR.
6H, Doublet
For each peak of the NMR, describe the chemical shift,
functional group, integration, splitting pattern, neighbors, the
molecule that the peak represents, and finally draw the final
structure of the NMR.
6H, Doublet
Draw the structures of each and predict the 1H NMR spectrum (approximate chemical shift, integration and...
Draw the structures of each and predict the 1H NMR spectrum (approximate chemical shift, integration and splitting): a) anisole b) 4-nitrotoluene
Index of H deficiency: Spectrum 4 CH1oO Chemical shift | # of H's from (ppm) #...
 Index of H deficiency: Spectrum 4 CH1oO Chemical shift | # of H's from (ppm) # of Hs on neighboring C atoms Multiplicity of | Splitting (s, d, t, q or m) integration Wavenumber Intensity Functional Group Assignment IR 2H 3H 4H IH PPM Draw the struture and assign peaks to each set of protons:
The H-NMR spectrum of an unknown compound (formula CaHgO2) is shown below. Draw the structure of...
 The H-NMR spectrum of an unknown compound (formula CaHgO2) is shown below. Draw the structure of the unknown compound. Question 5 4 1 6 5 8 10 11 Ppm The 13C-NMR spectrum of an unknown compound (formula CgH180) is shown below. Its 1H-NMR spectrum only shows one singlet at 1.2 ppm. Draw the structure of this unknown compound. uestion 2 220 200 160 140 120 PPM 100 80 240 180 60 40 20 Create OscerSketch Answer 2 What would be...
tant parts of the NMR spectrum shown below: a. Chemical shift for an individual peak (pick...
 tant parts of the NMR spectrum shown below: a. Chemical shift for an individual peak (pick one peak as an example) b. Integration value for an individual peak (pick one peak as an example) c. TMS peak d. Splitting of each peak (s, d, t, q, or m) Spectrum Scan [1/1) END VALu 750 731 652 790 758 234 Phenacetin 20- 731 200 445 322 190 2.58 184 15- 10- 6 x10 12 10 ppm Amplitude
tant parts of the...
tant parts of the NMR spectrum shown below: a. Chemical shift for an individual peak (pick one peak as an example) b. Integration value for an individual peak (pick one peak as an example) c. TMS peak d. Splitting of each peak (s, d, t, q, or m) Spectrum Scan [1/1) END VALu 750 731 652 790 758 234 Phenacetin 20- 731 200 445 322 190 2.58 184 15- 10- 6 x10 12 10 ppm Amplitude
tant parts of the...
 Draw a H NMR spectrum for each compound. Pay attention to the chemical shift (ppm) multiplicity, and integration of each peak. The boxes indicate where the peaks should go (which ppm range) as well as the relative height of each peak OH PPM O 3 PPM -2. H 10 8 PPM
 Part 2: Draw the NMR spectrum: Draw the structure of your molecule below, indicating each unique hydrogen atom with letters, starting with A. After complete the below table, summarizing the integration, approximate chemical shift, number of neighbors, and splitting pattern of each hydrogen in your given molecule. Note, you do not need to fill every row in the below table. By CH₃ Structures H₂C- 2 Brono- 4 methyl pertane Hydrogen Integration Letter A Chemical Number of Splitting Pattern Shift Neighbors...
 n-Butanol ОН Part 2: Draw the NMR spectrum Draw the structure of your molecule below, indicating each unique hydrogen atom with letters, starting with A. After complete the below table, summarizing the integration, approximate chemical shift number of neighbors, and splitting pattern of each hydrogen in your given molecule. Note, you do not need to fill every row in the below table. Structure: Hydrogen Integration Letter Chemical Number of Splitting Pattern Shift Neighbors Now, draw the NMR in the space...
 Predicting the Spectrum MR and C NMR) the expected 'H NMR number of si spectrum for the following molecule. Be sure to include appropriate for the following molecule. Be sure to er of signals, show spisina ar try to indicate relative Integration by arca un (label peak with some splitting and try to indicate relative Integration by area under peak peak with correct number for clarity in tabel all the unique hydrogens with letters and assign them to the peaks...
 4. Draw a clear and accurate NMR spectrum for the molecule shown below. Clearly show the number of peaks, and the integration, chemical shift and splitting of each peak. PP 5. Use the chemspider.com to look up the NMR spectrum for the compound in 4. Compare that spectrum to your answer in 4. Draw that spectrum here, explaining the differences between the actual spectrum and what you predicted. Don't worry if you what you initially drew was incorect PPM
 For each peak of the NMR, describe the chemical shift,
functional group, integration, splitting pattern, neighbors, the
molecule that the peak represents, and finally draw the final
structure of the NMR.
6H, Doublet
For each peak of the NMR, describe the chemical shift,
functional group, integration, splitting pattern, neighbors, the
molecule that the peak represents, and finally draw the final
structure of the NMR.
6H, Doublet
 Index of H deficiency: Spectrum 4 CH1oO Chemical shift | # of H's from (ppm) # of Hs on neighboring C atoms Multiplicity of | Splitting (s, d, t, q or m) integration Wavenumber Intensity Functional Group Assignment IR 2H 3H 4H IH PPM Draw the struture and assign peaks to each set of protons:
 The H-NMR spectrum of an unknown compound (formula CaHgO2) is shown below. Draw the structure of the unknown compound. Question 5 4 1 6 5 8 10 11 Ppm The 13C-NMR spectrum of an unknown compound (formula CgH180) is shown below. Its 1H-NMR spectrum only shows one singlet at 1.2 ppm. Draw the structure of this unknown compound. uestion 2 220 200 160 140 120 PPM 100 80 240 180 60 40 20 Create OscerSketch Answer 2 What would be...
 tant parts of the NMR spectrum shown below: a. Chemical shift for an individual peak (pick one peak as an example) b. Integration value for an individual peak (pick one peak as an example) c. TMS peak d. Splitting of each peak (s, d, t, q, or m) Spectrum Scan [1/1) END VALu 750 731 652 790 758 234 Phenacetin 20- 731 200 445 322 190 2.58 184 15- 10- 6 x10 12 10 ppm Amplitude
tant parts of the...
tant parts of the NMR spectrum shown below: a. Chemical shift for an individual peak (pick one peak as an example) b. Integration value for an individual peak (pick one peak as an example) c. TMS peak d. Splitting of each peak (s, d, t, q, or m) Spectrum Scan [1/1) END VALu 750 731 652 790 758 234 Phenacetin 20- 731 200 445 322 190 2.58 184 15- 10- 6 x10 12 10 ppm Amplitude
tant parts of the...
Most questions answered within 3 hours.
-
Where is the error in this code sequence?
String s1 = "Hello";
String s2 = "ello";...
asked 10 months ago -
Financial data for Joel de Paris, Inc., for last year
follow:
Joel de Paris, Inc.
Balance...
asked 10 months ago -
Consider this reaction:
Al2(SO4)3 (aq)+ BaCl3
(aq) Al2Cl6 (aq)- +
3BaSO4(s) . What is the...
asked 10 months ago -
Suppose that Savneet is considering increasing her
recent random sample from 20 car rentals to 40...
asked 10 months ago -
Trucks arrive at an unloading terminal at an average rate of 120
per hour.
Trucks arrive...
asked 10 months ago -
Why are methanol and ethanol completely soluble in water while
octanol is not very little soluble....
asked 10 months ago -
A facilities manager at a university reads in a research report
that the mean amount of...
asked 10 months ago -
When the CuSO4 is rehydrated by adding water to the anhydrous
compound, is this an endothermic...
asked 10 months ago -
A ray of sunlight is passing from diamond into crown glass; the
angle of incidence is...
asked 10 months ago -
A block of mass 0.249 kg is placed on top of a light, vertical
spring of...
asked 10 months ago -
how do the kidneys compensate in the presences of acidosis
a) trigger hyperventilate
b) reserve acid...
asked 10 months ago -
Question 501 pts
The rental rate of capital to the firm increases. Which of the
following...
asked 10 months ago