
Homework Answers
For Data Set 1=
d1 <- read.csv("C:/Users/pcc/Desktop/d1.csv")
> View(d1)
> x=d1$x
> y=d1$y
> y
[1] -1 0 1 0 -1 0 1 0 -1 0 1 0 -1
## To plot scatter plot ##
> plot(x,y)
## To Add line nest fit ##
> l1=lm(y~x,data=d1)
> l1
> abline(l1)

The Scatter plot shows there is no relation between x and y
## Correlation = ##
> cor(x,y)
[1] 0
The correlation between X and Y is 0.Hene there is no relation between x and y
## Covariance ##
> cov(y,x)
[1] 0
Here both variables constant,Because the coefficient is zero.
r square = 2.863e-32
### For data 2 = ###
> x= c(1,2,3,4,5,6,7)
y=c(5.1,8.0,15.5,10.3,18.7,25.3,22.5)
> l2=lm(y~x)
> l2
## to plot and add regression line ##
> plot(x,y)
> abline(l2)
 The Scatter plot shows there
is strong positive correlation between the two variable.
The Scatter plot shows there
is strong positive correlation between the two variable.
> cor(x,y)
[1] 0.9152279
From the correlation we observe that, there is strong positive correlation between the two variable.
> cov(x,y)
[1] 15
Here both variables tend to increase or decrease together,Because the coefficient is positive.
## r square ##
R square = 0.8376
r square imply that,Means the 83.76 % of variation explain by our explainatory variable to our dependent variable.
For data Set 3 =
> x=1:8
> x
[1] 1 2 3 4 5 6 7 8
> y=c(5.1,8.0,15.5,10.3,18.7,25.3,22.5,0)
> l3=lm(y~x)
> plot(x,y)
> abline(l3)
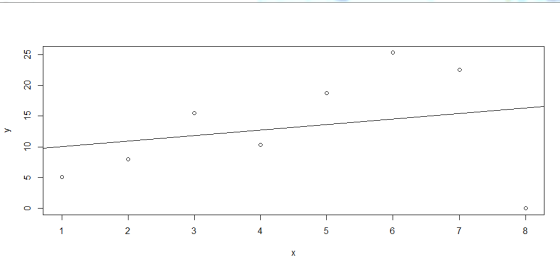
Here the Scatter plot shows there is low positive correlation between the two variable.
> cor(x,y)
[1] 0.2468258
Here the Scatter plot shows there is low positive correlation
between the two variable.
> cov(x,y)
[1] 5.328571
Here both variables tend to increase or decrease together,Because the coefficient is positive.
> summary(l2)
r squre = 0.0692
r square imply that ,the 6.92 % of variation explain by our explainatory variable to our dependent variable.
Add Answer to:
Question 3. For each of the following data sets use R to i) sketch a scatterplot...
Below are four bivariate data sets and the scatter plot for each. (Note that each scatter...
 Below are four bivariate data sets and the scatter plot for each. (Note that each scatter plot is displayed on the same scale.) Each data set is made up of sample values drawn from a population. x y 1.0 7.9 2.0 5.1 3.0 10.1 4.0 6.4 х 11 10+ 9+ 8+ 7+ 6+ 5- X X 1.0 7.3 117 10+ 2.0 9.0 9+ 3.0 7.3 8+ 7 4.0 5.6 6+ 5.0 7.9 5 4 6.0 5.3 2 7.0 4.8 5.0...
Questio 1.3.3 For the table of data find the following. a. Draw a scatterplot. b. Calculate...
 Questio 1.3.3 For the table of data find the following. a. Draw a scatterplot. b. Calculate the correlation coefficient. x1 2 3 4 5 6 7 8 9 10 D c. Calculate the least squares line and graph it on the scatterplot. d. Predict the y-value when x is 11 y 0.1 0.7 1.1 2.1 2.6 3.1 3.1 4.4 4.6 5.1 a. Choose the correct scatterplot below & A O C. OD. b. Calculate the correlation coefficient. (Do not round...
Below are four bivariate data sets and the scatter plot for each. (Note that each scatter...
 Below are four bivariate data sets and the scatter plot for each. (Note that each scatter plot is displayed on the same scale.) Each data set is made up of sample values drawn from a population. y 1.0 7.4 2.0 9.0 3.0 7.0 11 10- 11 102 9 8+ 7+ 8+ 71 61 5 5 41 4.0 5.4 5.0 7.5 6.05.2 7.0 4.5 8.0 7.1 9.0 5.5 10.0 3.9 V 1.0 8.0 2.0 6.9 3.07.3 4.0 6.1 5.0 7.4 6.0...
Compute the sample correlation coefficient r for each of the following data sets and show that...
Compute the sample correlation coefficient r for each of the following data sets and show that r is the same for both. (Use 3 decimal places.) (i) x 2 8 9 y 4 2 5 (ii) x 4 2 5 y 2 8 9
Below are four bivariate data sets and the scatter plot for each. (Note that each scatter...
Below are four bivariate data sets and the scatter plot for each. (Note that each scatter plot is displayed on the same scale.) Each data set is made up of sample values drawn from a population. x y 1.0 4.1 2.0 6.1 3.0 7.0 4.0 4.0 5.0 5.2 6.0 8.1 7.0 5.5 8.0 6.9 9.0 9.0 10.0 7.3 x1234567891011y12345678910110 Figure 1 u v 1.0 8.1 2.0 7.4 3.0 8.1 4.0 6.1 5.0 7.4 6.0 4.5 7.0 4.6 8.0 3.4...
Compute the sample correlation coefficient r for each of the following data sets. (Use 3 decimal...
Compute the sample correlation coefficient r for each of the following data sets. (Use 3 decimal places.) (a) x 3 1 9 y 1 3 5 (b) x 1 3 5 y 3 1 9 r(a) = r(b) =
or the following two data sets, construct a divided difference table. What conclusions can you make...
or the following two data sets, construct a divided difference table. What conclusions can you make about the data? Would you use a low-order polynomial as an empirical model? If so, what order? DATA SET 1. x 0 1 2 3 4 5 6 7 y 2 8 24 56 110 192 308 464 DATA SET 2. x 0 1 2 3 4 5 6 7 y 1 4.5 20 90 403 1808 8103 36316
Procedure Use the following sets of data and work with each one. The equation for a...
 Procedure Use the following sets of data and work with each one. The equation for a linear graph is y mx+b, where m is the slope and b is the y-intercept. DATA SET 1: Fahrenheit-vs- Celsius Fahrenheit Celsius 32 68 104 140 176 0 20 40 60 80 1. Using Data Set 1 above, graph Fahrenheit (y) -vs- Celsius (x), using the scatterplot function in excel, or another graphing software. Make sure you label the axes. Fahrenheit should be on...
Use the given data set to complete parts (a) through (c) below. (Use a = 0.05.)...
 Use the given data set to complete parts (a) through (c) below. (Use a = 0.05.) 5 х у 10 9.14 8 8.14 13 8.73 9 8.76 11 9.26 14 8.09 6 6.13 4 3.09 12 9.13 7 7.25 4.73 Click here to view a table of critical values for the correlation coefficient. a. Construct a scatterplot. Choose the correct graph below. OA. OB. O c. OD y AY 10- 8- Ay 10-1 a 10- 10- 8- 6- 8-1 8-...
please help me answer these questions based on the data Part 5: Correlation, Regression, and Goodness-of-fit test analysis. (20 pts) Using the midpoints as the x-variable and the frequencies as t...
 please help me answer these questions based on the data
Part 5: Correlation, Regression, and Goodness-of-fit test analysis. (20 pts) Using the midpoints as the x-variable and the frequencies as the y-variable of the different data sets of both groups of players, complete the following: I. Graph the scatterplot of points (x, y) to determine the outliers and influential points. Calculate the value for the Linear Correlation Coefficient (r) and give the interpretation. Using a significance level of 0.05, determine...
please help me answer these questions based on the data
Part 5: Correlation, Regression, and Goodness-of-fit test analysis. (20 pts) Using the midpoints as the x-variable and the frequencies as the y-variable of the different data sets of both groups of players, complete the following: I. Graph the scatterplot of points (x, y) to determine the outliers and influential points. Calculate the value for the Linear Correlation Coefficient (r) and give the interpretation. Using a significance level of 0.05, determine...
 Below are four bivariate data sets and the scatter plot for each. (Note that each scatter plot is displayed on the same scale.) Each data set is made up of sample values drawn from a population. x y 1.0 7.9 2.0 5.1 3.0 10.1 4.0 6.4 х 11 10+ 9+ 8+ 7+ 6+ 5- X X 1.0 7.3 117 10+ 2.0 9.0 9+ 3.0 7.3 8+ 7 4.0 5.6 6+ 5.0 7.9 5 4 6.0 5.3 2 7.0 4.8 5.0...
 Questio 1.3.3 For the table of data find the following. a. Draw a scatterplot. b. Calculate the correlation coefficient. x1 2 3 4 5 6 7 8 9 10 D c. Calculate the least squares line and graph it on the scatterplot. d. Predict the y-value when x is 11 y 0.1 0.7 1.1 2.1 2.6 3.1 3.1 4.4 4.6 5.1 a. Choose the correct scatterplot below & A O C. OD. b. Calculate the correlation coefficient. (Do not round...
 Below are four bivariate data sets and the scatter plot for each. (Note that each scatter plot is displayed on the same scale.) Each data set is made up of sample values drawn from a population. y 1.0 7.4 2.0 9.0 3.0 7.0 11 10- 11 102 9 8+ 7+ 8+ 71 61 5 5 41 4.0 5.4 5.0 7.5 6.05.2 7.0 4.5 8.0 7.1 9.0 5.5 10.0 3.9 V 1.0 8.0 2.0 6.9 3.07.3 4.0 6.1 5.0 7.4 6.0...
 Procedure Use the following sets of data and work with each one. The equation for a linear graph is y mx+b, where m is the slope and b is the y-intercept. DATA SET 1: Fahrenheit-vs- Celsius Fahrenheit Celsius 32 68 104 140 176 0 20 40 60 80 1. Using Data Set 1 above, graph Fahrenheit (y) -vs- Celsius (x), using the scatterplot function in excel, or another graphing software. Make sure you label the axes. Fahrenheit should be on...
 Use the given data set to complete parts (a) through (c) below. (Use a = 0.05.) 5 х у 10 9.14 8 8.14 13 8.73 9 8.76 11 9.26 14 8.09 6 6.13 4 3.09 12 9.13 7 7.25 4.73 Click here to view a table of critical values for the correlation coefficient. a. Construct a scatterplot. Choose the correct graph below. OA. OB. O c. OD y AY 10- 8- Ay 10-1 a 10- 10- 8- 6- 8-1 8-...
 please help me answer these questions based on the data
Part 5: Correlation, Regression, and Goodness-of-fit test analysis. (20 pts) Using the midpoints as the x-variable and the frequencies as the y-variable of the different data sets of both groups of players, complete the following: I. Graph the scatterplot of points (x, y) to determine the outliers and influential points. Calculate the value for the Linear Correlation Coefficient (r) and give the interpretation. Using a significance level of 0.05, determine...
please help me answer these questions based on the data
Part 5: Correlation, Regression, and Goodness-of-fit test analysis. (20 pts) Using the midpoints as the x-variable and the frequencies as the y-variable of the different data sets of both groups of players, complete the following: I. Graph the scatterplot of points (x, y) to determine the outliers and influential points. Calculate the value for the Linear Correlation Coefficient (r) and give the interpretation. Using a significance level of 0.05, determine...
Most questions answered within 3 hours.
-
Where is the error in this code sequence?
String s1 = "Hello";
String s2 = "ello";...
asked 10 months ago -
Financial data for Joel de Paris, Inc., for last year
follow:
Joel de Paris, Inc.
Balance...
asked 10 months ago -
Consider this reaction:
Al2(SO4)3 (aq)+ BaCl3
(aq) Al2Cl6 (aq)- +
3BaSO4(s) . What is the...
asked 10 months ago -
Suppose that Savneet is considering increasing her
recent random sample from 20 car rentals to 40...
asked 10 months ago -
Trucks arrive at an unloading terminal at an average rate of 120
per hour.
Trucks arrive...
asked 10 months ago -
Why are methanol and ethanol completely soluble in water while
octanol is not very little soluble....
asked 10 months ago -
A facilities manager at a university reads in a research report
that the mean amount of...
asked 10 months ago -
When the CuSO4 is rehydrated by adding water to the anhydrous
compound, is this an endothermic...
asked 10 months ago -
A ray of sunlight is passing from diamond into crown glass; the
angle of incidence is...
asked 10 months ago -
A block of mass 0.249 kg is placed on top of a light, vertical
spring of...
asked 10 months ago -
how do the kidneys compensate in the presences of acidosis
a) trigger hyperventilate
b) reserve acid...
asked 10 months ago -
Question 501 pts
The rental rate of capital to the firm increases. Which of the
following...
asked 10 months ago