please help! I know the answers but I don't know how to get them.
Homework Answers
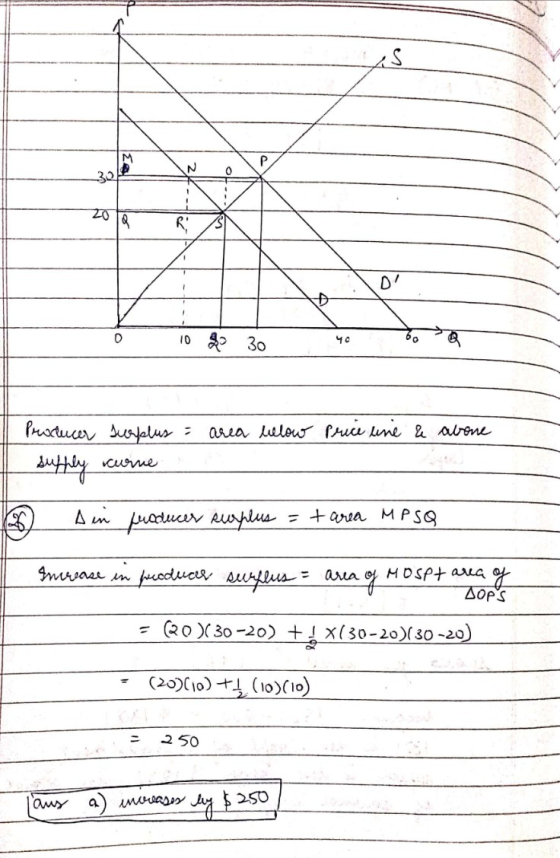

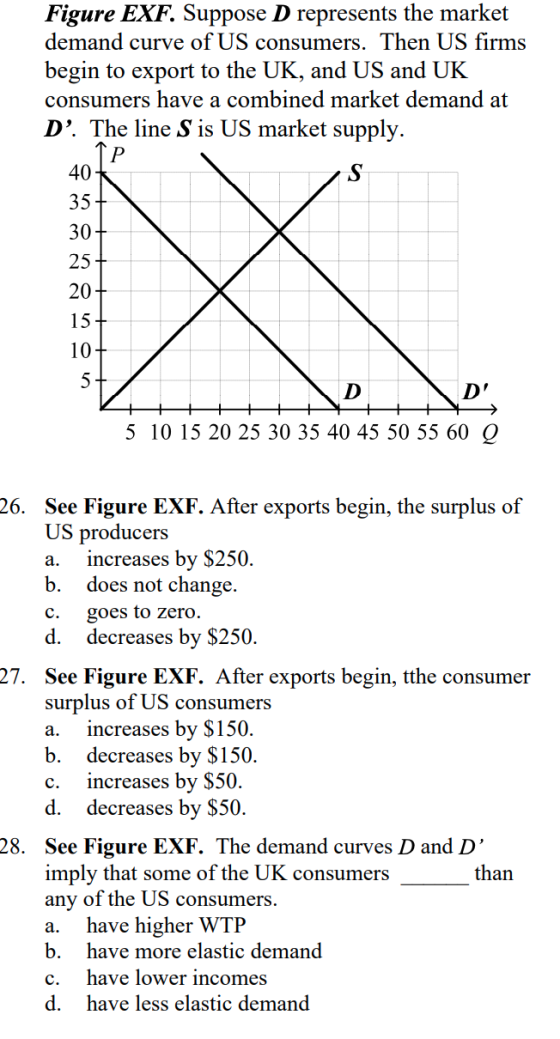
28. Answer a. Have higher WTP. (Willingness to pay)
For example: at quantity 25. US consumers are willing to pay a price of $15 (from D). But for the same quantity of 25, the combined price is $35, hence UK consumers have high WTP
Let me know if you have any doubt :)
Add Answer to:
please help! I know the answers but I don't know how to get
them.
Figure EXF....
I know the answers to these but I need an explanation. Please draw on the graph....
 I know the answers to these but I need an explanation. Please
draw on the graph. For 31,32 and 33
Figure CPS. The US Textile Market Suppose D is market demand and S is the market supply curve of domestic producers. After imports are allowed, foreign producers shift the market supply to S' P 25 20 15 10 5 60 Q 10 20 30 40 50 See Figure CPS. Before the foreign producers enter the producer surplus of domestic producers...
I know the answers to these but I need an explanation. Please
draw on the graph. For 31,32 and 33
Figure CPS. The US Textile Market Suppose D is market demand and S is the market supply curve of domestic producers. After imports are allowed, foreign producers shift the market supply to S' P 25 20 15 10 5 60 Q 10 20 30 40 50 See Figure CPS. Before the foreign producers enter the producer surplus of domestic producers...
need to know the math behind finding these answers Figure &-6 The vertical distance between points...
 need to know the math behind finding these answers
Figure &-6 The vertical distance between points A and B represents a tax in the market. Price 22 20 18 Supply 16 14 12 10 6 Demand 2 + Quantity 100 200 300 400 500 600 700 800 900 10001 1001200 8. Refer to Figure 8-6. Without a tax, the equilibrium price and quantity are a. $16 and 300. $10 and 300. d. $6 and 300. $10 and 600. b. c....
need to know the math behind finding these answers
Figure &-6 The vertical distance between points A and B represents a tax in the market. Price 22 20 18 Supply 16 14 12 10 6 Demand 2 + Quantity 100 200 300 400 500 600 700 800 900 10001 1001200 8. Refer to Figure 8-6. Without a tax, the equilibrium price and quantity are a. $16 and 300. $10 and 300. d. $6 and 300. $10 and 600. b. c....
I have a solution, but don't know how to get it:
 I have a solution, but don't know how to get it:
3. A businessman purchases perishable commodities in the wholesale market at $10 each and sells them on the retail market at $15 each. He hence makes a profit of $5 for every unit he sells. But the commodities are perishable and so any units unsold at the end of the day are discarded and he incurs a loss of $10 on each unit he discards. (I've chosen toy numbers...
I have a solution, but don't know how to get it:
3. A businessman purchases perishable commodities in the wholesale market at $10 each and sells them on the retail market at $15 each. He hence makes a profit of $5 for every unit he sells. But the commodities are perishable and so any units unsold at the end of the day are discarded and he incurs a loss of $10 on each unit he discards. (I've chosen toy numbers...
I need help solving this Asap. thanks alot. Figure 1: Supply and Demand in the Market...
 I need help solving this Asap. thanks alot.
Figure 1: Supply and Demand in the Market for a Good Price ($/unit) 35 27 Supply 23 19 15 13 11 9 Demand 5 13 17 Quantity (units) 11 12 10 8 6 14. Refer to Figure 1. At the market equilibrium, total consumer surplus is $10 b. $50 а. $100 d. $200 15. Refer to Figure 1. Holding the supply curve fixed, assume demand increased, which caused the equilibrium price to...
I need help solving this Asap. thanks alot.
Figure 1: Supply and Demand in the Market for a Good Price ($/unit) 35 27 Supply 23 19 15 13 11 9 Demand 5 13 17 Quantity (units) 11 12 10 8 6 14. Refer to Figure 1. At the market equilibrium, total consumer surplus is $10 b. $50 а. $100 d. $200 15. Refer to Figure 1. Holding the supply curve fixed, assume demand increased, which caused the equilibrium price to...
Explain why answers are correct. I already know the correct answer, i need to know why....
 Explain why answers are correct. I already know the correct
answer, i need to know why.
Figure TXA. Suppose the government imposes a $10 per-unit tax on a good. 20+ A - - 16+ 14+ 12+- - - - FI 10+ D il H G -- - -- -- - 4+ K L ; M - - - 4 8 12 16 20 24 28 32 36 0 17. See Figure TXA. The tax causes consumer surplus to decrease by...
Explain why answers are correct. I already know the correct
answer, i need to know why.
Figure TXA. Suppose the government imposes a $10 per-unit tax on a good. 20+ A - - 16+ 14+ 12+- - - - FI 10+ D il H G -- - -- -- - 4+ K L ; M - - - 4 8 12 16 20 24 28 32 36 0 17. See Figure TXA. The tax causes consumer surplus to decrease by...
The figure illustrates the market for coffee in Guatemala. | Price 150+ -- Domestic supply World...
 The figure illustrates the market for coffee in Guatemala. | Price 150+ -- Domestic supply World price H Domestic demand 2 4 6 8 10 12 14 16 18 20 22 24 26 28 30 32 34 36 38 40 42 44 46 48 50 52 Quantity Refer to Figure 9-1. When trade in coffee is allowed. producer surplus in Guatemala a. increases by the area B-D. b. increases by the area B-D-G. c. decreases by the area C +F....
How am I meant to find the initial consumer surplus if I don’t know at which...
 How am I meant to find the initial consumer surplus if I don’t
know at which point on the p axis , q=0?? Help! PLEASEE
Block 3: Elasticity Activity SG3.11 Multiple choice question Here you see the football fans' demand curve d for televised football matches together with the Football Association's (FA) supply curve s for such matches. The market for televised matches clears where the two curves cross, hence when 10 matches are televised for £6 each. Suppose now...
How am I meant to find the initial consumer surplus if I don’t
know at which point on the p axis , q=0?? Help! PLEASEE
Block 3: Elasticity Activity SG3.11 Multiple choice question Here you see the football fans' demand curve d for televised football matches together with the Football Association's (FA) supply curve s for such matches. The market for televised matches clears where the two curves cross, hence when 10 matches are televised for £6 each. Suppose now...
Can someone help me solve this problem? I want to know the solving method. Thank you!...
Can someone help me solve this problem? I want to know the solving method. Thank you! :) Questions 1 and 2 Refer to a market with the following information to be taken as given: ?? = 3? ?D = 20 − ? Calculate the producer surplus, assuming there is a monopoly supplier who is able to use first-degree price discrimination. a. 40 b. 42 c. 48 d. 50 Suppose the government forces the monopolist to charge a single price. It...
I just need help with parts B and C, I know those answers are correct but...
I just need help with parts B and C, I know those answers are correct but have no clue how to do them. Please show step by step! Thank you!:) A) Assume the following: Number of college students in the market: 25,000 Average number of copies per student per year 125 Your company’s estimated share of the total market 13% Total annual market demand 3,125,000 Estimated annual company demand 406,250 Estimated monthly demand 33,854 Estimated weekly demand 7,813 Given the following for your copy business: Annual Expenses:...
please explain in detail number 18 and make sure i can understand ur handwriting please Figure...
 please explain in detail number 18 and make sure i can understand
ur handwriting please
Figure 9-22 The following diagram shows the domestic demand and domestic supply in a market. In addition, assume that the world price in this market is $40 per unit. tMce 190 180 Domestic Supply 170 160 150 140 130 130 110 100 90 80 70 60- 50 40 30 Domestic Demand 20 30 Qity 1000 1300 1400 1500 1800 2000 2200 2400 200 400 600...
please explain in detail number 18 and make sure i can understand
ur handwriting please
Figure 9-22 The following diagram shows the domestic demand and domestic supply in a market. In addition, assume that the world price in this market is $40 per unit. tMce 190 180 Domestic Supply 170 160 150 140 130 130 110 100 90 80 70 60- 50 40 30 Domestic Demand 20 30 Qity 1000 1300 1400 1500 1800 2000 2200 2400 200 400 600...
 I know the answers to these but I need an explanation. Please
draw on the graph. For 31,32 and 33
Figure CPS. The US Textile Market Suppose D is market demand and S is the market supply curve of domestic producers. After imports are allowed, foreign producers shift the market supply to S' P 25 20 15 10 5 60 Q 10 20 30 40 50 See Figure CPS. Before the foreign producers enter the producer surplus of domestic producers...
I know the answers to these but I need an explanation. Please
draw on the graph. For 31,32 and 33
Figure CPS. The US Textile Market Suppose D is market demand and S is the market supply curve of domestic producers. After imports are allowed, foreign producers shift the market supply to S' P 25 20 15 10 5 60 Q 10 20 30 40 50 See Figure CPS. Before the foreign producers enter the producer surplus of domestic producers...
 need to know the math behind finding these answers
Figure &-6 The vertical distance between points A and B represents a tax in the market. Price 22 20 18 Supply 16 14 12 10 6 Demand 2 + Quantity 100 200 300 400 500 600 700 800 900 10001 1001200 8. Refer to Figure 8-6. Without a tax, the equilibrium price and quantity are a. $16 and 300. $10 and 300. d. $6 and 300. $10 and 600. b. c....
need to know the math behind finding these answers
Figure &-6 The vertical distance between points A and B represents a tax in the market. Price 22 20 18 Supply 16 14 12 10 6 Demand 2 + Quantity 100 200 300 400 500 600 700 800 900 10001 1001200 8. Refer to Figure 8-6. Without a tax, the equilibrium price and quantity are a. $16 and 300. $10 and 300. d. $6 and 300. $10 and 600. b. c....
 I have a solution, but don't know how to get it:
3. A businessman purchases perishable commodities in the wholesale market at $10 each and sells them on the retail market at $15 each. He hence makes a profit of $5 for every unit he sells. But the commodities are perishable and so any units unsold at the end of the day are discarded and he incurs a loss of $10 on each unit he discards. (I've chosen toy numbers...
I have a solution, but don't know how to get it:
3. A businessman purchases perishable commodities in the wholesale market at $10 each and sells them on the retail market at $15 each. He hence makes a profit of $5 for every unit he sells. But the commodities are perishable and so any units unsold at the end of the day are discarded and he incurs a loss of $10 on each unit he discards. (I've chosen toy numbers...
 I need help solving this Asap. thanks alot.
Figure 1: Supply and Demand in the Market for a Good Price ($/unit) 35 27 Supply 23 19 15 13 11 9 Demand 5 13 17 Quantity (units) 11 12 10 8 6 14. Refer to Figure 1. At the market equilibrium, total consumer surplus is $10 b. $50 а. $100 d. $200 15. Refer to Figure 1. Holding the supply curve fixed, assume demand increased, which caused the equilibrium price to...
I need help solving this Asap. thanks alot.
Figure 1: Supply and Demand in the Market for a Good Price ($/unit) 35 27 Supply 23 19 15 13 11 9 Demand 5 13 17 Quantity (units) 11 12 10 8 6 14. Refer to Figure 1. At the market equilibrium, total consumer surplus is $10 b. $50 а. $100 d. $200 15. Refer to Figure 1. Holding the supply curve fixed, assume demand increased, which caused the equilibrium price to...
 Explain why answers are correct. I already know the correct
answer, i need to know why.
Figure TXA. Suppose the government imposes a $10 per-unit tax on a good. 20+ A - - 16+ 14+ 12+- - - - FI 10+ D il H G -- - -- -- - 4+ K L ; M - - - 4 8 12 16 20 24 28 32 36 0 17. See Figure TXA. The tax causes consumer surplus to decrease by...
Explain why answers are correct. I already know the correct
answer, i need to know why.
Figure TXA. Suppose the government imposes a $10 per-unit tax on a good. 20+ A - - 16+ 14+ 12+- - - - FI 10+ D il H G -- - -- -- - 4+ K L ; M - - - 4 8 12 16 20 24 28 32 36 0 17. See Figure TXA. The tax causes consumer surplus to decrease by...
 The figure illustrates the market for coffee in Guatemala. | Price 150+ -- Domestic supply World price H Domestic demand 2 4 6 8 10 12 14 16 18 20 22 24 26 28 30 32 34 36 38 40 42 44 46 48 50 52 Quantity Refer to Figure 9-1. When trade in coffee is allowed. producer surplus in Guatemala a. increases by the area B-D. b. increases by the area B-D-G. c. decreases by the area C +F....
 How am I meant to find the initial consumer surplus if I don’t
know at which point on the p axis , q=0?? Help! PLEASEE
Block 3: Elasticity Activity SG3.11 Multiple choice question Here you see the football fans' demand curve d for televised football matches together with the Football Association's (FA) supply curve s for such matches. The market for televised matches clears where the two curves cross, hence when 10 matches are televised for £6 each. Suppose now...
How am I meant to find the initial consumer surplus if I don’t
know at which point on the p axis , q=0?? Help! PLEASEE
Block 3: Elasticity Activity SG3.11 Multiple choice question Here you see the football fans' demand curve d for televised football matches together with the Football Association's (FA) supply curve s for such matches. The market for televised matches clears where the two curves cross, hence when 10 matches are televised for £6 each. Suppose now...
 please explain in detail number 18 and make sure i can understand
ur handwriting please
Figure 9-22 The following diagram shows the domestic demand and domestic supply in a market. In addition, assume that the world price in this market is $40 per unit. tMce 190 180 Domestic Supply 170 160 150 140 130 130 110 100 90 80 70 60- 50 40 30 Domestic Demand 20 30 Qity 1000 1300 1400 1500 1800 2000 2200 2400 200 400 600...
please explain in detail number 18 and make sure i can understand
ur handwriting please
Figure 9-22 The following diagram shows the domestic demand and domestic supply in a market. In addition, assume that the world price in this market is $40 per unit. tMce 190 180 Domestic Supply 170 160 150 140 130 130 110 100 90 80 70 60- 50 40 30 Domestic Demand 20 30 Qity 1000 1300 1400 1500 1800 2000 2200 2400 200 400 600...
Most questions answered within 3 hours.
-
Where is the error in this code sequence?
String s1 = "Hello";
String s2 = "ello";...
asked 10 months ago -
Financial data for Joel de Paris, Inc., for last year
follow:
Joel de Paris, Inc.
Balance...
asked 10 months ago -
Consider this reaction:
Al2(SO4)3 (aq)+ BaCl3
(aq) Al2Cl6 (aq)- +
3BaSO4(s) . What is the...
asked 10 months ago -
Suppose that Savneet is considering increasing her
recent random sample from 20 car rentals to 40...
asked 10 months ago -
Trucks arrive at an unloading terminal at an average rate of 120
per hour.
Trucks arrive...
asked 10 months ago -
Why are methanol and ethanol completely soluble in water while
octanol is not very little soluble....
asked 10 months ago -
A facilities manager at a university reads in a research report
that the mean amount of...
asked 10 months ago -
When the CuSO4 is rehydrated by adding water to the anhydrous
compound, is this an endothermic...
asked 10 months ago -
A ray of sunlight is passing from diamond into crown glass; the
angle of incidence is...
asked 10 months ago -
A block of mass 0.249 kg is placed on top of a light, vertical
spring of...
asked 10 months ago -
how do the kidneys compensate in the presences of acidosis
a) trigger hyperventilate
b) reserve acid...
asked 10 months ago -
Question 501 pts
The rental rate of capital to the firm increases. Which of the
following...
asked 10 months ago