Test the claim that there is correlation between CPI and Cost of Pizza with ? =...
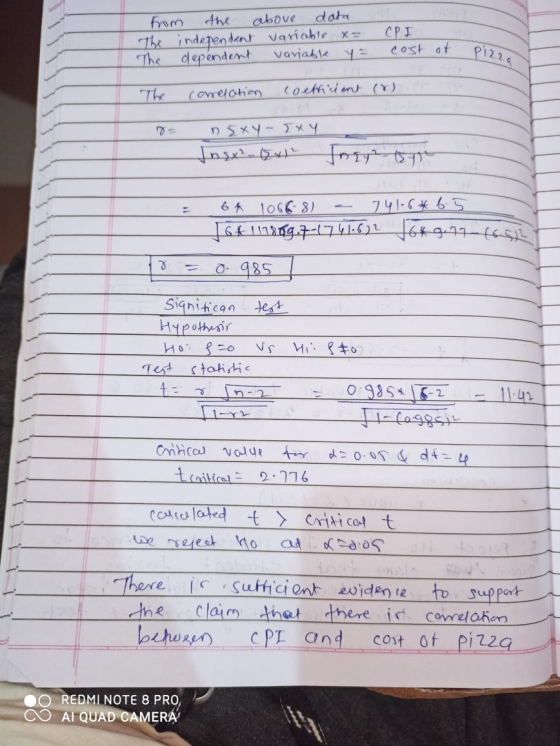
Test the claim that there is correlation between CPI and Cost of Pizza with ? = 0.05.
|
CPI |
30.2 |
48.3 |
112.3 |
162.2 |
191.9 |
197.8 |
|
Cost of Pizza |
0.15 |
0.35 |
1.00 |
1.25 |
1.75 |
2.00 |
Homework Answers
Add Answer to:
Test the claim that there is correlation between CPI and Cost of
Pizza with ? =...
Testing for Rank Correlation. In Exercises 7-12, use the rank correlation coefficient to test for a correlation between...
 Testing for Rank Correlation. In Exercises 7-12, use the rank correlation coefficient to test for a correlation between the two variables. Use a significance level of α = 0.05 9. Pizza and the Subway The "pizza connection" is the principle that the price of a slice of pizza in New York City is always about the same as the subway fare. Use the data listed below to determine whether there is a correlation between the cost of a slice of...
4. The following data set presents CPI (Consumer Price Index) of the US and the price...
 4. The following data set presents CPI (Consumer Price Index) of the US and the price of a regular cheese pizza at the same time. CPI 30.2 48.3 12.3 162.2 191.9 197.8 Cost of Pizza 0.15 0.35 1.00 1.25 1.75 2.00 (a) (10 points) Assuming a linear relation between CPI (a) and pizza price ), find the least square estimation for the regression coefficients. (b) (10 points) Use the data to test the hypothesis that the pizza price does not...
Please explain in detail. Thank you. 15. Pizza and the Subway Use the pizza costs and...
 Please explain in detail. Thank you.
15. Pizza and the Subway Use the pizza costs and subway fares to find the best predicted subway fare, given that the cost of a slice of pizza is $3.00. Is the best predicted subway fare likely to be implemented? Year Pizza Cost Subway Fare CPI 1960 0.15 0.15 30.2 1973 0.35 0.35 48. 3 1986 1.00 1.00 112.3 1995 1.25 1.35 162.2 2002 1.75 1.50 191.9 2003 2.00 2.00 197.8 2009 2.25 2.25...
Please explain in detail. Thank you.
15. Pizza and the Subway Use the pizza costs and subway fares to find the best predicted subway fare, given that the cost of a slice of pizza is $3.00. Is the best predicted subway fare likely to be implemented? Year Pizza Cost Subway Fare CPI 1960 0.15 0.15 30.2 1973 0.35 0.35 48. 3 1986 1.00 1.00 112.3 1995 1.25 1.35 162.2 2002 1.75 1.50 191.9 2003 2.00 2.00 197.8 2009 2.25 2.25...
Could you teach me do this by Ti83or 84? Below is data collected over 6 specific years. The data collected is the Consumer Price Index (CPT) and the cost of a slice of pizza We would...
 Could you teach me do this by Ti83or 84?
Below is data collected over 6 specific years. The data collected is the Consumer Price Index (CPT) and the cost of a slice of pizza We would like to build a model using the CPI to predict the cost of a slice of pizza in a given year. Year 1960 1973 1986 1995 2002 2003 CPI (x) 30.2 48.3 112.3 162.2 191.9 197.8 Cost of a slice 0.15 0.35 1.00 1.25...
Could you teach me do this by Ti83or 84?
Below is data collected over 6 specific years. The data collected is the Consumer Price Index (CPT) and the cost of a slice of pizza We would like to build a model using the CPI to predict the cost of a slice of pizza in a given year. Year 1960 1973 1986 1995 2002 2003 CPI (x) 30.2 48.3 112.3 162.2 191.9 197.8 Cost of a slice 0.15 0.35 1.00 1.25...
Test the claim that the correlation between two variables is zero when a sample of 27...
Test the claim that the correlation between two variables is zero when a sample of 27 points has the correlation coefficient of 0.35. Test with alpha = 0.1.
Example 7: Use a critical value method to conduct a formal hypothesis test of the claim...
 Example 7: Use a critical value method to conduct a formal hypothesis test of the claim that there is a linear correlation between the cost of pizza and the subway fare. Table 10-2 Costs of a Slice of Pizza and Subway Fare (in dollars) Cost of Pizza Subway Fane 015 3 100 125 175200 015 0.35 100 1.55 150 2.00 Table 10-3 Calculatingr with Formula 10-1 015 015 0 35 tco 0225 1225 10000 0.0225 00225 01225 100 10000 10000...
The graph below shows the marginal, average variable, and average total cost curves for a pizza...
 The graph below shows the marginal, average variable, and average total cost curves for a pizza seller. Refer to the graph to answer the following questions. Instructions: Indicate the profit-maximizing level of output. Enter your response as a whole number. Cost Curves 3.50 3.25 3.00 2.75 Select Select Select 2.50 (S/slice) 2.00 W 1.75 1.50 1.25 1.00 0.75 0.50 0.25 100 200 300 400 500 600 700 800 900 Q -> Quantity (slices/day) a. What is the amount of the...
Consider a multiple regression model of the dependent variable y on independent variables x1, X2, X3, and x4: Using data with n 60 observations for each of the variables, a student obtains the follow...
 Consider a multiple regression model of the dependent variable y on independent variables x1, X2, X3, and x4: Using data with n 60 observations for each of the variables, a student obtains the following estimated regression equation for the model given: y0.35 0.58x1 + 0.45x2-0.25x3 - 0.10x4 He would like to conduct significance tests for a multiple regression relationship. He uses the F test to determine whether a significant relationship exists between the dependent variable and He uses the t...
Perform the 6 step process to test the claim: There is a positive linear correlation between the duration of an eruption and the time to the next eruption. Make sure in step four to show the scatte...
 Perform the 6 step process to test the claim: There
is a positive linear correlation between the duration of an
eruption and the time to the next eruption. Make sure in
step four to show the scatter plot and the residual plot to see if
linear regression is appropriate.
Summary duration Graph of residuals tatistics Multiple correlation coefficient 6 Coefficient of determination R2 0,921365528 0,848914437 0,844938501 5,410216471 15 10 7 RA2 adjusted 8 Typical error 10 11 VARIANCE ANALYSIS 12...
Perform the 6 step process to test the claim: There
is a positive linear correlation between the duration of an
eruption and the time to the next eruption. Make sure in
step four to show the scatter plot and the residual plot to see if
linear regression is appropriate.
Summary duration Graph of residuals tatistics Multiple correlation coefficient 6 Coefficient of determination R2 0,921365528 0,848914437 0,844938501 5,410216471 15 10 7 RA2 adjusted 8 Typical error 10 11 VARIANCE ANALYSIS 12...
 Testing for Rank Correlation. In Exercises 7-12, use the rank correlation coefficient to test for a correlation between the two variables. Use a significance level of α = 0.05 9. Pizza and the Subway The "pizza connection" is the principle that the price of a slice of pizza in New York City is always about the same as the subway fare. Use the data listed below to determine whether there is a correlation between the cost of a slice of...
 4. The following data set presents CPI (Consumer Price Index) of the US and the price of a regular cheese pizza at the same time. CPI 30.2 48.3 12.3 162.2 191.9 197.8 Cost of Pizza 0.15 0.35 1.00 1.25 1.75 2.00 (a) (10 points) Assuming a linear relation between CPI (a) and pizza price ), find the least square estimation for the regression coefficients. (b) (10 points) Use the data to test the hypothesis that the pizza price does not...
 Please explain in detail. Thank you.
15. Pizza and the Subway Use the pizza costs and subway fares to find the best predicted subway fare, given that the cost of a slice of pizza is $3.00. Is the best predicted subway fare likely to be implemented? Year Pizza Cost Subway Fare CPI 1960 0.15 0.15 30.2 1973 0.35 0.35 48. 3 1986 1.00 1.00 112.3 1995 1.25 1.35 162.2 2002 1.75 1.50 191.9 2003 2.00 2.00 197.8 2009 2.25 2.25...
Please explain in detail. Thank you.
15. Pizza and the Subway Use the pizza costs and subway fares to find the best predicted subway fare, given that the cost of a slice of pizza is $3.00. Is the best predicted subway fare likely to be implemented? Year Pizza Cost Subway Fare CPI 1960 0.15 0.15 30.2 1973 0.35 0.35 48. 3 1986 1.00 1.00 112.3 1995 1.25 1.35 162.2 2002 1.75 1.50 191.9 2003 2.00 2.00 197.8 2009 2.25 2.25...
 Could you teach me do this by Ti83or 84?
Below is data collected over 6 specific years. The data collected is the Consumer Price Index (CPT) and the cost of a slice of pizza We would like to build a model using the CPI to predict the cost of a slice of pizza in a given year. Year 1960 1973 1986 1995 2002 2003 CPI (x) 30.2 48.3 112.3 162.2 191.9 197.8 Cost of a slice 0.15 0.35 1.00 1.25...
Could you teach me do this by Ti83or 84?
Below is data collected over 6 specific years. The data collected is the Consumer Price Index (CPT) and the cost of a slice of pizza We would like to build a model using the CPI to predict the cost of a slice of pizza in a given year. Year 1960 1973 1986 1995 2002 2003 CPI (x) 30.2 48.3 112.3 162.2 191.9 197.8 Cost of a slice 0.15 0.35 1.00 1.25...
 Example 7: Use a critical value method to conduct a formal hypothesis test of the claim that there is a linear correlation between the cost of pizza and the subway fare. Table 10-2 Costs of a Slice of Pizza and Subway Fare (in dollars) Cost of Pizza Subway Fane 015 3 100 125 175200 015 0.35 100 1.55 150 2.00 Table 10-3 Calculatingr with Formula 10-1 015 015 0 35 tco 0225 1225 10000 0.0225 00225 01225 100 10000 10000...
 The graph below shows the marginal, average variable, and average total cost curves for a pizza seller. Refer to the graph to answer the following questions. Instructions: Indicate the profit-maximizing level of output. Enter your response as a whole number. Cost Curves 3.50 3.25 3.00 2.75 Select Select Select 2.50 (S/slice) 2.00 W 1.75 1.50 1.25 1.00 0.75 0.50 0.25 100 200 300 400 500 600 700 800 900 Q -> Quantity (slices/day) a. What is the amount of the...
 Consider a multiple regression model of the dependent variable y on independent variables x1, X2, X3, and x4: Using data with n 60 observations for each of the variables, a student obtains the following estimated regression equation for the model given: y0.35 0.58x1 + 0.45x2-0.25x3 - 0.10x4 He would like to conduct significance tests for a multiple regression relationship. He uses the F test to determine whether a significant relationship exists between the dependent variable and He uses the t...
 Perform the 6 step process to test the claim: There
is a positive linear correlation between the duration of an
eruption and the time to the next eruption. Make sure in
step four to show the scatter plot and the residual plot to see if
linear regression is appropriate.
Summary duration Graph of residuals tatistics Multiple correlation coefficient 6 Coefficient of determination R2 0,921365528 0,848914437 0,844938501 5,410216471 15 10 7 RA2 adjusted 8 Typical error 10 11 VARIANCE ANALYSIS 12...
Perform the 6 step process to test the claim: There
is a positive linear correlation between the duration of an
eruption and the time to the next eruption. Make sure in
step four to show the scatter plot and the residual plot to see if
linear regression is appropriate.
Summary duration Graph of residuals tatistics Multiple correlation coefficient 6 Coefficient of determination R2 0,921365528 0,848914437 0,844938501 5,410216471 15 10 7 RA2 adjusted 8 Typical error 10 11 VARIANCE ANALYSIS 12...
Most questions answered within 3 hours.
-
Where is the error in this code sequence?
String s1 = "Hello";
String s2 = "ello";...
asked 10 months ago -
Financial data for Joel de Paris, Inc., for last year
follow:
Joel de Paris, Inc.
Balance...
asked 10 months ago -
Consider this reaction:
Al2(SO4)3 (aq)+ BaCl3
(aq) Al2Cl6 (aq)- +
3BaSO4(s) . What is the...
asked 10 months ago -
Suppose that Savneet is considering increasing her
recent random sample from 20 car rentals to 40...
asked 10 months ago -
Trucks arrive at an unloading terminal at an average rate of 120
per hour.
Trucks arrive...
asked 10 months ago -
Why are methanol and ethanol completely soluble in water while
octanol is not very little soluble....
asked 10 months ago -
A facilities manager at a university reads in a research report
that the mean amount of...
asked 10 months ago -
When the CuSO4 is rehydrated by adding water to the anhydrous
compound, is this an endothermic...
asked 10 months ago -
A ray of sunlight is passing from diamond into crown glass; the
angle of incidence is...
asked 10 months ago -
A block of mass 0.249 kg is placed on top of a light, vertical
spring of...
asked 10 months ago -
how do the kidneys compensate in the presences of acidosis
a) trigger hyperventilate
b) reserve acid...
asked 10 months ago -
Question 501 pts
The rental rate of capital to the firm increases. Which of the
following...
asked 10 months ago