The marketing manager of a firm that produces laundry products decides to test market a new...
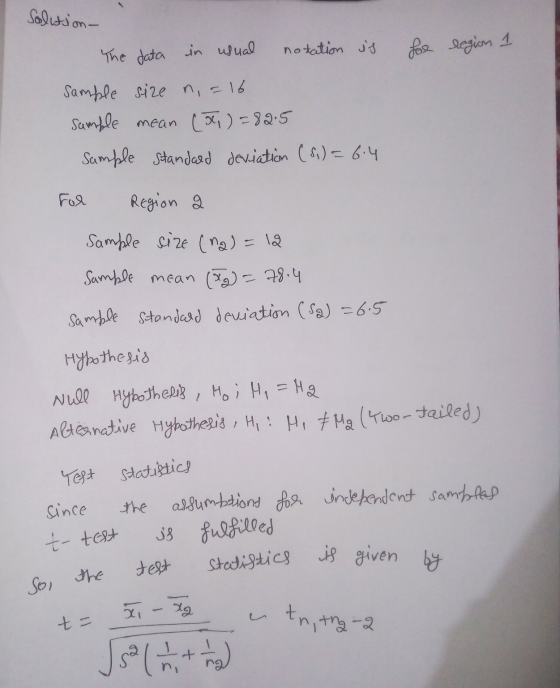
The marketing manager of a firm that produces laundry products decides to test market a new laundry product in each of the firm's two sales regions. He wants to determine whether there will be a difference in mean sales per market per month between the two regions. A random sample of 16 supermarkets from Region 1 had mean sales of 82.5 with a standard deviation of 6.4. A random sample of 12 supermarkets from Region 2 had a mean sales of 78.4 with a standard deviation of 6.5. Does the test marketing reveal a difference in potential mean sales per market in Region 2? Let μ1 be the mean sales per market in Region 1 and μ2 be the mean sales per market in Region 2. Use a significance level of α=0.05 for the test. Assume that the population variances are not equal and that the two populations are normally distributed.
Step 3 of 4 : Determine the decision rule for rejecting the null hypothesis H0. Round your answer to three decimal places.
Homework Answers
the data in usual notation is for region 1
sample size n1 is 16
![where san cm-1,38 + (09-1152 [ com U nitng-2 +(12-1) (6.532) sa o 16+12-2 [(16-1)16.4327 ob [61447 614.4+ 464.75] 58 41.5057](http://img.homeworklib.com/questions/80ebd230-fa37-11eb-a130-2758c7f84f2d.png?x-oss-process=image/resize,w_560)

Add Answer to:
The marketing manager of a firm that produces laundry products
decides to test market a new...
The marketing manager of a firm that produces laundry products decides to test market a new...
The marketing manager of a firm that produces laundry products decides to test market a new laundry product in each of the firm's two sales regions. He wants to determine whether there will be a difference in mean sales per market per month between the two regions. A random sample of 12 supermarkets from Region 1 had mean sales of 84 with a standard deviation of 6.66.6. A random sample of 17 supermarkets from Region 2 had a mean sales...
The marketing manager of a irm that produces laundry products decides to test market a new...
 The marketing manager of a irm that produces laundry products decides to test market a new laundry product in each of the fim's two sales regions. He wants to determine whether there will be a difference in mean sales per market per month between the two regions. A random sample of 18 supermarkets from Region 1 had potential mean sales per market in Reg on 2? Let ?? be the mean sales per market in Reg on 1 andn be...
Question 4 of 4, Step 2 of 4 7/16 Correct The marketing manager of a firm...
 Question 4 of 4, Step 2 of 4 7/16 Correct The marketing manager of a firm that produces laundry products decides to test market a new laundry product in each of the firm's two sales regions. He wants to determine whether there will be a difference in mean sales per market per month between the two regions. A random sample of 17 supermarkets from Region 1 had mean sales of 85.3 with a standard deviation of 5.1. A random sample...
A market research firm supplies manufacturers with estimates of the retail sales of their products from...
A market research firm supplies manufacturers with estimates of the retail sales of their products from samples of retail stores. Marketing managers are prone to look at the estimate and ignore sampling error. An SRS of 2222 stores this year shows mean sales of 6868 units of a small appliance, with a standard deviation of 66 units. During the same point in time last year, an SRS of 2323 stores had mean sales of 62.962.9 units, with standard deviation 15.715.7...
A market research firm supplies manufacturers with estimates of the retail sales of their products from...
A market research firm supplies manufacturers with estimates of the retail sales of their products from samples of retail stores. Marketing managers are prone to look at the estimate and ignore sampling error. An SRS of 29 stores this year shows mean sales of 77 units of a small appliance, with a standard deviation of 15 units. During the same point in time last year, an SRS of 18 stores had mean sales of 92.75 units, with standard deviation 12.1...
A study of fox rabies in a country gave the following information about different regions and the occurrence of rabies i...
A study of fox rabies in a country gave the following information about different regions and the occurrence of rabies in each region. A random sample of n1 = 16 locations in region I gave the following information about the number of cases of fox rabies near that location. x1: Region I Data 2 9 9 9 6 8 8 1 3 3 3 2 5 1 4 6 A second random sample of n2 = 15 locations in...
Consider two populations. A random sample of 15 observations from the first population revealed a sample...
Consider two populations. A random sample of 15 observations from the first population revealed a sample mean of 300 and a sample standard deviation of 12. A random sample of 18 observations from the second population revealed a sample mean of 293 and a sample standard deviation of 14. Test the hypotheses H0 : μ1 − μ2 = 0 and H1 : μ1 − μ2 ≠ 0 ,respectively. (a) Calculate the pooled estimate of the population variance. (b) Test the...
A random sample of 49 measurements from one population had a sample mean of 10, with...
A random sample of 49 measurements from one population had a sample mean of 10, with sample standard deviation 3. An independent random sample of 64 measurements from a second population had a sample mean of 12, with sample standard deviation 4. Test the claim that the population means are different. Use level of significance 0.01. (c) Compute x1 − x2. x1 − x2 = Compute the corresponding sample distribution value. (Test the difference μ1 − μ2. Round your answer...
(1 point) A market research firm supplies manufacturers with estimates of the retail sales of their...
 (1 point) A market research firm supplies manufacturers with estimates of the retail sales of their products from samples of retail stores. Marketing managers are prone to look at the estimate and ignore sampling error. An SRS of 15 stores this year shows mean sales of 75 units of a small appliance, with a standard deviation of 14.4 units. During the same point in time last year, an SRS of 27 stores had mean sales of 88.392 units, with standard...
A random sample of 49 measurements from a population with population standard deviation σ1 = 3...
A random sample of 49 measurements from a population with population standard deviation σ1 = 3 had a sample mean of x1 = 8. An independent random sample of 64 measurements from a second population with population standard deviation σ2 = 4 had a sample mean of x2 = 10. Test the claim that the population means are different. Use level of significance 0.01. 1. Compute x1 − x2 and x1 − x2 = 2. Compute the corresponding sample distribution...
 The marketing manager of a irm that produces laundry products decides to test market a new laundry product in each of the fim's two sales regions. He wants to determine whether there will be a difference in mean sales per market per month between the two regions. A random sample of 18 supermarkets from Region 1 had potential mean sales per market in Reg on 2? Let ?? be the mean sales per market in Reg on 1 andn be...
 Question 4 of 4, Step 2 of 4 7/16 Correct The marketing manager of a firm that produces laundry products decides to test market a new laundry product in each of the firm's two sales regions. He wants to determine whether there will be a difference in mean sales per market per month between the two regions. A random sample of 17 supermarkets from Region 1 had mean sales of 85.3 with a standard deviation of 5.1. A random sample...
 (1 point) A market research firm supplies manufacturers with estimates of the retail sales of their products from samples of retail stores. Marketing managers are prone to look at the estimate and ignore sampling error. An SRS of 15 stores this year shows mean sales of 75 units of a small appliance, with a standard deviation of 14.4 units. During the same point in time last year, an SRS of 27 stores had mean sales of 88.392 units, with standard...
Most questions answered within 3 hours.
-
Where is the error in this code sequence?
String s1 = "Hello";
String s2 = "ello";...
asked 11 months ago -
Financial data for Joel de Paris, Inc., for last year
follow:
Joel de Paris, Inc.
Balance...
asked 11 months ago -
Consider this reaction:
Al2(SO4)3 (aq)+ BaCl3
(aq) Al2Cl6 (aq)- +
3BaSO4(s) . What is the...
asked 11 months ago -
Suppose that Savneet is considering increasing her
recent random sample from 20 car rentals to 40...
asked 11 months ago -
Trucks arrive at an unloading terminal at an average rate of 120
per hour.
Trucks arrive...
asked 11 months ago -
Why are methanol and ethanol completely soluble in water while
octanol is not very little soluble....
asked 11 months ago -
A facilities manager at a university reads in a research report
that the mean amount of...
asked 11 months ago -
When the CuSO4 is rehydrated by adding water to the anhydrous
compound, is this an endothermic...
asked 11 months ago -
A ray of sunlight is passing from diamond into crown glass; the
angle of incidence is...
asked 11 months ago -
A block of mass 0.249 kg is placed on top of a light, vertical
spring of...
asked 11 months ago -
how do the kidneys compensate in the presences of acidosis
a) trigger hyperventilate
b) reserve acid...
asked 11 months ago -
Question 501 pts
The rental rate of capital to the firm increases. Which of the
following...
asked 11 months ago