
Homework Answers

Add Answer to:
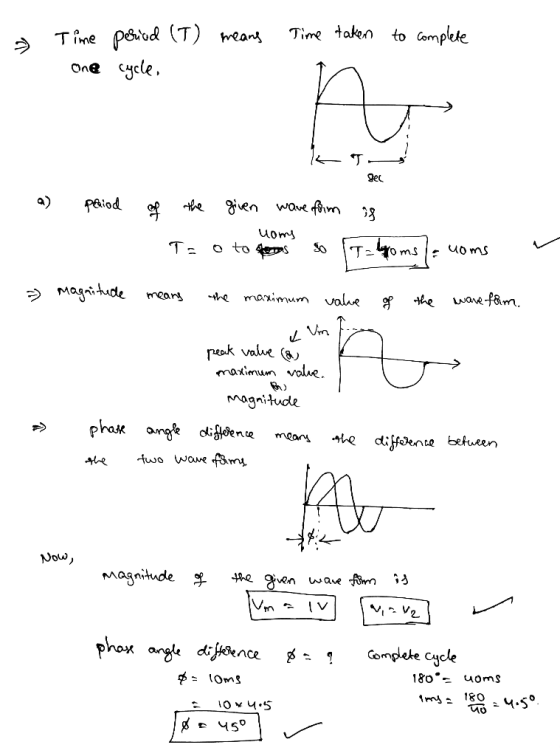
1. Given the two voltages VI and V2 depicted in the plot below, calculate the following...
"the difference junction circuit" Figure 2-5 below is the circuit for subtracting two voltages, Vi and...
 "the difference junction circuit"
Figure 2-5 below is the circuit for subtracting two voltages, Vi and 12. Again, the required components are an op-amp and resistors. 15V V2 R3 R1 100kOhm 100kOhm - 15V -15V 15V Vout R2 100kOhm R4 w 100kOhm 15V -15V Figure 2-5: The Difference Circuit Experiment Steps 1. Build the circuit according to the circuit diagram. Notice that the two potentiometer on the left side are 0 - 1 k 2 potentiometers. Set and measure the...
"the difference junction circuit"
Figure 2-5 below is the circuit for subtracting two voltages, Vi and 12. Again, the required components are an op-amp and resistors. 15V V2 R3 R1 100kOhm 100kOhm - 15V -15V 15V Vout R2 100kOhm R4 w 100kOhm 15V -15V Figure 2-5: The Difference Circuit Experiment Steps 1. Build the circuit according to the circuit diagram. Notice that the two potentiometer on the left side are 0 - 1 k 2 potentiometers. Set and measure the...
Answer Q2 Q1. Use MATLAB to calculate sum of the AC voltages. Plot all three voltages...
 Answer Q2
Q1. Use MATLAB to calculate sum of the AC voltages. Plot all three voltages in the same figure using the inbuilt function subplot(). The frequency of the signal is 10 Hz. Vary the time, t, so that you can view few cycles of the AC voltage. vi(t) = 10 V sin(wt +T/2) vz(t) =15 V sin(wt+1/3) vs(t) = (t) + v2(t) Q2. Use voltage vi(t) from Q1 and impedance, Z = 50 L 30°, and find phasor current...
Answer Q2
Q1. Use MATLAB to calculate sum of the AC voltages. Plot all three voltages in the same figure using the inbuilt function subplot(). The frequency of the signal is 10 Hz. Vary the time, t, so that you can view few cycles of the AC voltage. vi(t) = 10 V sin(wt +T/2) vz(t) =15 V sin(wt+1/3) vs(t) = (t) + v2(t) Q2. Use voltage vi(t) from Q1 and impedance, Z = 50 L 30°, and find phasor current...
Consider the following circuit. a) Using any method you want, calculate Vo(t) given Vi(t) = u(t)...
 Consider the following circuit.
a) Using any method you want, calculate Vo(t) given Vi(t) =
u(t) for the following circuit and plot as a function of
time.
b) Calcualte Vo(t) when Vi(t) = e^(j2(pi)ft) and plot the
magnitude ans phase as a function of f.
pts) Q.1) Consider the following circuit. 2 H o,(t) 3 2 (15 pts) Using any method you want, calculate vo(t) given v(t)-u() for the following circuit and plot as a function of time. (15 pts)...
Consider the following circuit.
a) Using any method you want, calculate Vo(t) given Vi(t) =
u(t) for the following circuit and plot as a function of
time.
b) Calcualte Vo(t) when Vi(t) = e^(j2(pi)ft) and plot the
magnitude ans phase as a function of f.
pts) Q.1) Consider the following circuit. 2 H o,(t) 3 2 (15 pts) Using any method you want, calculate vo(t) given v(t)-u() for the following circuit and plot as a function of time. (15 pts)...
1. Under dc conditions, for Figure 1 (a) Calculate the voltages v1 and v2 of the...
 1. Under dc conditions, for Figure 1 (a) Calculate the voltages v1
and v2 of the circuit capacitors and their respective stored
energy. What power does the voltage source deliver (60 V).
10 Ω 50 Ω 20 Ω + + 40 Ω C +0, 2 C, (+1) 60 V Figura 1 (a)
1. Under dc conditions, for Figure 1 (a) Calculate the voltages v1
and v2 of the circuit capacitors and their respective stored
energy. What power does the voltage source deliver (60 V).
10 Ω 50 Ω 20 Ω + + 40 Ω C +0, 2 C, (+1) 60 V Figura 1 (a)
Use the circuit below to complete the given MATLAB script to plot the three voltages Vr,...
 Use the circuit below to complete the given MATLAB script to
plot the three voltages Vr, Vc and VL. Run MATLAB then pick an
answer from the choices below that matches the MATLAB plot.
MATLAB uncomplete script
clc; close all; clear all;
Mvs= 10;
Avs=30*pi/180;
[Xvs Yvs]=pol2cart(Avs, Mvs);
Vs=Xvs+j*Yvs;
% Impedances values
Zr=4; ZL=10j; Zc=-12j;
% total equivalent impedance of series R, L and C
Zeq = ; %complete
% Calculate current
It = ; %complete
Vr= ; %complete
Vc=...
Use the circuit below to complete the given MATLAB script to
plot the three voltages Vr, Vc and VL. Run MATLAB then pick an
answer from the choices below that matches the MATLAB plot.
MATLAB uncomplete script
clc; close all; clear all;
Mvs= 10;
Avs=30*pi/180;
[Xvs Yvs]=pol2cart(Avs, Mvs);
Vs=Xvs+j*Yvs;
% Impedances values
Zr=4; ZL=10j; Zc=-12j;
% total equivalent impedance of series R, L and C
Zeq = ; %complete
% Calculate current
It = ; %complete
Vr= ; %complete
Vc=...
3. Determine the following for the waveforms in Figure 4 given that each time division is...
 3. Determine the following for the waveforms in Figure 4 given that each time division is 5ms and each voltage division is 2V. a. peak voltages for each waveform b. period for both waveforms c. time delay, At, between vi() and v2(t). d. phase constant for v2(t)
1. Consider the op-amp Circuit below 001uF 100Ω .1uF Vi Vo a. The Gain can be...
 1. Consider the op-amp Circuit below 001uF 100Ω .1uF Vi Vo a. The Gain can be put in the form: what are the values for Ao, z1, 0z2, Op1, and ώρ27(Note that the resistors and capacitors of Zf and Zi are > order of magnitude apart. You can make approximations.) 0 Vi 1+ copi op2 b. Sketch a rough Bode plot (magnitude and Phase) Simulate the circuit using LTSPICE using an LT1001 op amp powered with+/-15V and plot the magnitude...
Part VI: Fill in the table to calculate some intermediate points. Plot these points to complete...
Part VI: Fill in the table to calculate some intermediate points. Plot these points to complete your sketch of the graph in Part V above. Estimate the location of the relative maximum and minimum values. (4 points) H(x) = x3 − 7x2 − x + 7 x −1 −0.5 0 0.5 1 2 3 4 5 6 7 y 0 4.875 0 −15 −45 −35 0
I got part a to be 1 and .92 1. Given the following matrix A- 05 .97 a. calculate the eigenvalues by using RStudio. b. calculate the integer values of the eigenvectors, vi and v2 by hand only calc...
 I got part a to be 1 and .92
1. Given the following matrix A- 05 .97 a. calculate the eigenvalues by using RStudio. b. calculate the integer values of the eigenvectors, vi and v2 by hand only calculate the weights ci and c2, such that: c. given x d. Calculating the long-term behavior of a dynamic system: Remembering, in general Ax Ax fill in using ci and c2, the eigenvalues λ1 and λ2 and vectors vi and v2. e....
I got part a to be 1 and .92
1. Given the following matrix A- 05 .97 a. calculate the eigenvalues by using RStudio. b. calculate the integer values of the eigenvectors, vi and v2 by hand only calculate the weights ci and c2, such that: c. given x d. Calculating the long-term behavior of a dynamic system: Remembering, in general Ax Ax fill in using ci and c2, the eigenvalues λ1 and λ2 and vectors vi and v2. e....
Please include your matlab code and plot, as well as the derivation of the expressions for...
 Please include your matlab code and plot, as well as the
derivation of the expressions for voltages across both the resistor
and inductor themselves. Really need help understanding this!
5. Consider the RL Circuit shown below. Assume the excitation is a 10 kHz sine wave with amplitude of 1 volt. Derive expressions for the voltages across the resistor and the inductor as time functions. Plot the voltages across the resistor and the inductor over two periods using MATLAB and a...
Please include your matlab code and plot, as well as the
derivation of the expressions for voltages across both the resistor
and inductor themselves. Really need help understanding this!
5. Consider the RL Circuit shown below. Assume the excitation is a 10 kHz sine wave with amplitude of 1 volt. Derive expressions for the voltages across the resistor and the inductor as time functions. Plot the voltages across the resistor and the inductor over two periods using MATLAB and a...
 "the difference junction circuit"
Figure 2-5 below is the circuit for subtracting two voltages, Vi and 12. Again, the required components are an op-amp and resistors. 15V V2 R3 R1 100kOhm 100kOhm - 15V -15V 15V Vout R2 100kOhm R4 w 100kOhm 15V -15V Figure 2-5: The Difference Circuit Experiment Steps 1. Build the circuit according to the circuit diagram. Notice that the two potentiometer on the left side are 0 - 1 k 2 potentiometers. Set and measure the...
"the difference junction circuit"
Figure 2-5 below is the circuit for subtracting two voltages, Vi and 12. Again, the required components are an op-amp and resistors. 15V V2 R3 R1 100kOhm 100kOhm - 15V -15V 15V Vout R2 100kOhm R4 w 100kOhm 15V -15V Figure 2-5: The Difference Circuit Experiment Steps 1. Build the circuit according to the circuit diagram. Notice that the two potentiometer on the left side are 0 - 1 k 2 potentiometers. Set and measure the...
 Answer Q2
Q1. Use MATLAB to calculate sum of the AC voltages. Plot all three voltages in the same figure using the inbuilt function subplot(). The frequency of the signal is 10 Hz. Vary the time, t, so that you can view few cycles of the AC voltage. vi(t) = 10 V sin(wt +T/2) vz(t) =15 V sin(wt+1/3) vs(t) = (t) + v2(t) Q2. Use voltage vi(t) from Q1 and impedance, Z = 50 L 30°, and find phasor current...
Answer Q2
Q1. Use MATLAB to calculate sum of the AC voltages. Plot all three voltages in the same figure using the inbuilt function subplot(). The frequency of the signal is 10 Hz. Vary the time, t, so that you can view few cycles of the AC voltage. vi(t) = 10 V sin(wt +T/2) vz(t) =15 V sin(wt+1/3) vs(t) = (t) + v2(t) Q2. Use voltage vi(t) from Q1 and impedance, Z = 50 L 30°, and find phasor current...
 Consider the following circuit.
a) Using any method you want, calculate Vo(t) given Vi(t) =
u(t) for the following circuit and plot as a function of
time.
b) Calcualte Vo(t) when Vi(t) = e^(j2(pi)ft) and plot the
magnitude ans phase as a function of f.
pts) Q.1) Consider the following circuit. 2 H o,(t) 3 2 (15 pts) Using any method you want, calculate vo(t) given v(t)-u() for the following circuit and plot as a function of time. (15 pts)...
Consider the following circuit.
a) Using any method you want, calculate Vo(t) given Vi(t) =
u(t) for the following circuit and plot as a function of
time.
b) Calcualte Vo(t) when Vi(t) = e^(j2(pi)ft) and plot the
magnitude ans phase as a function of f.
pts) Q.1) Consider the following circuit. 2 H o,(t) 3 2 (15 pts) Using any method you want, calculate vo(t) given v(t)-u() for the following circuit and plot as a function of time. (15 pts)...
 1. Under dc conditions, for Figure 1 (a) Calculate the voltages v1
and v2 of the circuit capacitors and their respective stored
energy. What power does the voltage source deliver (60 V).
10 Ω 50 Ω 20 Ω + + 40 Ω C +0, 2 C, (+1) 60 V Figura 1 (a)
1. Under dc conditions, for Figure 1 (a) Calculate the voltages v1
and v2 of the circuit capacitors and their respective stored
energy. What power does the voltage source deliver (60 V).
10 Ω 50 Ω 20 Ω + + 40 Ω C +0, 2 C, (+1) 60 V Figura 1 (a)
 Use the circuit below to complete the given MATLAB script to
plot the three voltages Vr, Vc and VL. Run MATLAB then pick an
answer from the choices below that matches the MATLAB plot.
MATLAB uncomplete script
clc; close all; clear all;
Mvs= 10;
Avs=30*pi/180;
[Xvs Yvs]=pol2cart(Avs, Mvs);
Vs=Xvs+j*Yvs;
% Impedances values
Zr=4; ZL=10j; Zc=-12j;
% total equivalent impedance of series R, L and C
Zeq = ; %complete
% Calculate current
It = ; %complete
Vr= ; %complete
Vc=...
Use the circuit below to complete the given MATLAB script to
plot the three voltages Vr, Vc and VL. Run MATLAB then pick an
answer from the choices below that matches the MATLAB plot.
MATLAB uncomplete script
clc; close all; clear all;
Mvs= 10;
Avs=30*pi/180;
[Xvs Yvs]=pol2cart(Avs, Mvs);
Vs=Xvs+j*Yvs;
% Impedances values
Zr=4; ZL=10j; Zc=-12j;
% total equivalent impedance of series R, L and C
Zeq = ; %complete
% Calculate current
It = ; %complete
Vr= ; %complete
Vc=...
 3. Determine the following for the waveforms in Figure 4 given that each time division is 5ms and each voltage division is 2V. a. peak voltages for each waveform b. period for both waveforms c. time delay, At, between vi() and v2(t). d. phase constant for v2(t)
 1. Consider the op-amp Circuit below 001uF 100Ω .1uF Vi Vo a. The Gain can be put in the form: what are the values for Ao, z1, 0z2, Op1, and ώρ27(Note that the resistors and capacitors of Zf and Zi are > order of magnitude apart. You can make approximations.) 0 Vi 1+ copi op2 b. Sketch a rough Bode plot (magnitude and Phase) Simulate the circuit using LTSPICE using an LT1001 op amp powered with+/-15V and plot the magnitude...
 I got part a to be 1 and .92
1. Given the following matrix A- 05 .97 a. calculate the eigenvalues by using RStudio. b. calculate the integer values of the eigenvectors, vi and v2 by hand only calculate the weights ci and c2, such that: c. given x d. Calculating the long-term behavior of a dynamic system: Remembering, in general Ax Ax fill in using ci and c2, the eigenvalues λ1 and λ2 and vectors vi and v2. e....
I got part a to be 1 and .92
1. Given the following matrix A- 05 .97 a. calculate the eigenvalues by using RStudio. b. calculate the integer values of the eigenvectors, vi and v2 by hand only calculate the weights ci and c2, such that: c. given x d. Calculating the long-term behavior of a dynamic system: Remembering, in general Ax Ax fill in using ci and c2, the eigenvalues λ1 and λ2 and vectors vi and v2. e....
 Please include your matlab code and plot, as well as the
derivation of the expressions for voltages across both the resistor
and inductor themselves. Really need help understanding this!
5. Consider the RL Circuit shown below. Assume the excitation is a 10 kHz sine wave with amplitude of 1 volt. Derive expressions for the voltages across the resistor and the inductor as time functions. Plot the voltages across the resistor and the inductor over two periods using MATLAB and a...
Please include your matlab code and plot, as well as the
derivation of the expressions for voltages across both the resistor
and inductor themselves. Really need help understanding this!
5. Consider the RL Circuit shown below. Assume the excitation is a 10 kHz sine wave with amplitude of 1 volt. Derive expressions for the voltages across the resistor and the inductor as time functions. Plot the voltages across the resistor and the inductor over two periods using MATLAB and a...
Most questions answered within 3 hours.
-
Where is the error in this code sequence?
String s1 = "Hello";
String s2 = "ello";...
asked 10 months ago -
Financial data for Joel de Paris, Inc., for last year
follow:
Joel de Paris, Inc.
Balance...
asked 10 months ago -
Consider this reaction:
Al2(SO4)3 (aq)+ BaCl3
(aq) Al2Cl6 (aq)- +
3BaSO4(s) . What is the...
asked 10 months ago -
Suppose that Savneet is considering increasing her
recent random sample from 20 car rentals to 40...
asked 10 months ago -
Trucks arrive at an unloading terminal at an average rate of 120
per hour.
Trucks arrive...
asked 10 months ago -
Why are methanol and ethanol completely soluble in water while
octanol is not very little soluble....
asked 10 months ago -
A facilities manager at a university reads in a research report
that the mean amount of...
asked 10 months ago -
When the CuSO4 is rehydrated by adding water to the anhydrous
compound, is this an endothermic...
asked 10 months ago -
A ray of sunlight is passing from diamond into crown glass; the
angle of incidence is...
asked 10 months ago -
A block of mass 0.249 kg is placed on top of a light, vertical
spring of...
asked 10 months ago -
how do the kidneys compensate in the presences of acidosis
a) trigger hyperventilate
b) reserve acid...
asked 10 months ago -
Question 501 pts
The rental rate of capital to the firm increases. Which of the
following...
asked 10 months ago