
Homework Answers


Add Answer to:
Of n1 randomly selected male smokers, X1 smoked filter cigarettes, whereas of n2 randomly selected female...
Let the independent random variables X1 and X2 have binomial distributions with parameters n1, p1 =...
Let the independent random variables X1 and X2 have binomial distributions with parameters n1, p1 = 1/2 and n2, p2 = 1/2 , respectively. Show that Y = X1−X2+n2 has a binomial distribution with parameters n = n1+n2, p = ½ I want clear steps and explanations.
Of n randomly selected engineering students at ASU, X1 owned an HP calculator, and ofn2 randomly...
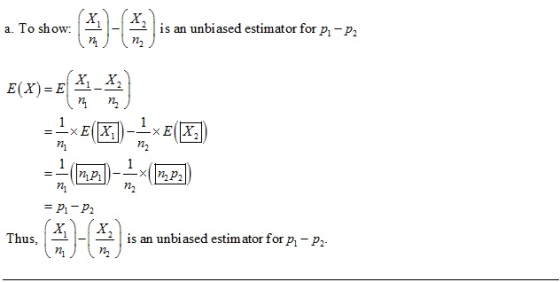
 Of n randomly selected engineering students at ASU, X1 owned an HP calculator, and ofn2 randomly selected engineering students at Virginia Tech, X2 owned an HP calculator. Let p, and p2 be the probability that randomly selected ASU and Virginia Tech engineering students, respectively, own HP calculators (a) Model the two random variables X1, X2 as a reasonable random variable with appropriate parameters (b) Show that an unbiased estimator for Ф-Pa) is (X1/nl-X2/n2) (c) What is the standard error of...
Let N1=40, X1=30, N2=40 and X2=20 Calculate the test statistic ZSTAT based on the difference P1-P2...
Let N1=40, X1=30, N2=40 and X2=20 Calculate the test statistic ZSTAT based on the difference P1-P2 the test statistic, ZSTAT is what?
Construct a confidence interval for p1−p2 at the given level of confidence. x1=365, n1=503, x2=447, n2=558,...
Construct a confidence interval for p1−p2 at the given level of confidence. x1=365, n1=503, x2=447, n2=558, 95% confidence
Construct a confidence interval for p1−p2 at the given level of confidence. x1=365 n1=536 x2=435 n2=593...
Construct a confidence interval for p1−p2 at the given level of confidence. x1=365 n1=536 x2=435 n2=593 90% confidence The researchers are (blank) % confident the difference between the two population proportions, p1−p2, is between (blank) and (blank)
Independent random samples of n1 = 120 and n2 = 120 observations were randomly selected from...
Independent random samples of n1 = 120 and n2 = 120 observations were randomly selected from binomial populations 1 and 2, respectively. Sample 1 had 62 successes, and sample 2 had 67 successes. You wish to perform a hypothesis test to determine if there is a difference in the sample proportions p1 and p2. (a) State the null and alternative hypotheses. - H0: (p1 − p2) = 0 versus Ha: (p1 − p2) ≠ 0 - H0: (p1 − p2)...
The weights of randomly selected 5 female students and 5 male students are given by the...
The weights of randomly selected 5 female students and 5 male students are given by the following:weights for male students:160,165,152,158,178weights for female students:169,154,158,156,162.Let the weight distributions of male and female students follow N(μ1,σ1) and N(μ2,σ2)respectively.• TestH0:σ1=σ2vs.H1:σ16=σ2at 5% level of significance. UseF4,4,0.025= 0.10F4,4,0.975= 9.60.
Independent random samples of n1 = 900 and n2 = 780 observations were selected from binomial...
Independent random samples of n1 = 900 and n2 = 780 observations were selected from binomial populations 1 and 2, and x1 = 336 and x2 = 378 successes were observed. (a) Find a 90% confidence interval for the difference (p1 − p2) in the two population proportions. (Round your answers to three decimal places.) What assumptions must you make for the confidence interval to be valid? (Select all that apply.) 1. independent samples 2. random samples 3. n1 +...
The weights of randomly selected 5 female students and 5 male students are given by the...
The weights of randomly selected 5 female students and 5 male students are given by the following: weights for male students:160,165,152,158,178 weights for female students:169,154,158,156,162. Let the weight distributions of male and female students follow N(μ1,σ1) and N(μ2,σ2) respectively. • Test H0 : u1 = μ2 VS u1 cant equal u2 at 5% level of significance. Use P(t8>2.30) =0.025. (5 points)
The weights of randomly selected 5 female students and 5 male students are given bythe following:weights...
The weights of randomly selected 5 female students and 5 male students are given bythe following:weights for male students:160,165,152,158,178weights for female students:169,154,158,156,162.Let the weight distributions of male and female students follow N(μ1,σ1) and N(μ2,σ2)respectively. TestH0:μ1=μ2vs.μ16=μ2at 5% level of significance. UseP(t8>2.30) =0.025. (5 points)
 Of n randomly selected engineering students at ASU, X1 owned an HP calculator, and ofn2 randomly selected engineering students at Virginia Tech, X2 owned an HP calculator. Let p, and p2 be the probability that randomly selected ASU and Virginia Tech engineering students, respectively, own HP calculators (a) Model the two random variables X1, X2 as a reasonable random variable with appropriate parameters (b) Show that an unbiased estimator for Ф-Pa) is (X1/nl-X2/n2) (c) What is the standard error of...
Most questions answered within 3 hours.
-
Where is the error in this code sequence?
String s1 = "Hello";
String s2 = "ello";...
asked 11 months ago -
Financial data for Joel de Paris, Inc., for last year
follow:
Joel de Paris, Inc.
Balance...
asked 11 months ago -
Consider this reaction:
Al2(SO4)3 (aq)+ BaCl3
(aq) Al2Cl6 (aq)- +
3BaSO4(s) . What is the...
asked 11 months ago -
Suppose that Savneet is considering increasing her
recent random sample from 20 car rentals to 40...
asked 11 months ago -
Trucks arrive at an unloading terminal at an average rate of 120
per hour.
Trucks arrive...
asked 11 months ago -
Why are methanol and ethanol completely soluble in water while
octanol is not very little soluble....
asked 11 months ago -
A facilities manager at a university reads in a research report
that the mean amount of...
asked 11 months ago -
When the CuSO4 is rehydrated by adding water to the anhydrous
compound, is this an endothermic...
asked 11 months ago -
A ray of sunlight is passing from diamond into crown glass; the
angle of incidence is...
asked 11 months ago -
A block of mass 0.249 kg is placed on top of a light, vertical
spring of...
asked 11 months ago -
how do the kidneys compensate in the presences of acidosis
a) trigger hyperventilate
b) reserve acid...
asked 11 months ago -
Question 501 pts
The rental rate of capital to the firm increases. Which of the
following...
asked 11 months ago