
Homework Answers
Add Answer to:
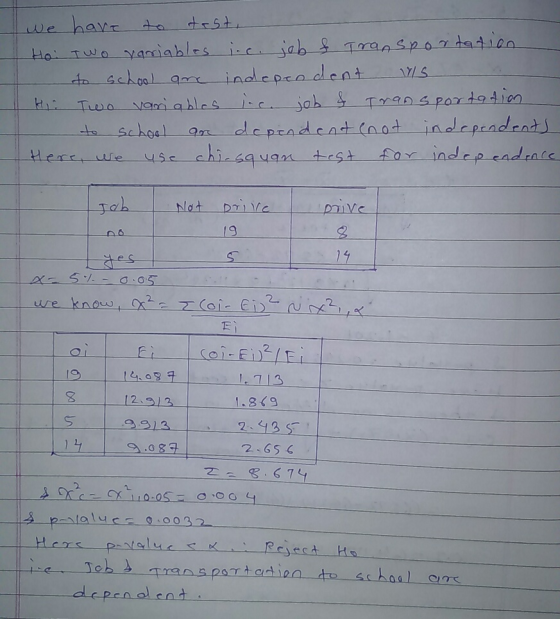
4. The following data was collected from Dr. Perry's statistics class comparing if students had a...
Suppose a student organization at a university collected data for a study involving class sizes from...
Suppose a student organization at a university collected data for a study involving class sizes from different departments. The following table shows the average class size from a random sample of classes in the business school vs. the average class size from a random sample of classes in the engineering school. Data for the sample sizes and standard deviations are also shown. Use this data to complete parts a through c. Business Engineering Sample mean 38.5 31.2 Sample standard deviation...
The data stored in QuizPulse10 contains pulse rates collected from 10 students in a class lecture...
 The data stored in QuizPulse10 contains pulse rates collected from 10 students in a class lecture and then from the same students during a quiz. Use R to carry out all the necessary calculations. a. The 99% confidence interval for the difference in mean pulse rates between students in a class lecture and taking the quiz (Class lecture pulse rates quiz pulse rates) is (round to 4 decimal places): ( b, True or False-The probability that the true mean difference...
A research team collected data on n= 450 students in a statistics course. The observed average...
 A research team collected data on n= 450 students in a statistics course. The observed average final examination score was 524, with an observed standard deviation of 127.6 (the divisor in the estimated variance was n-1). The average first examination score was 397, with an observed standard deviation of 96.4. The correlation coefficient between the first examination score and the final examination score was 0.63. a. Report the analysis of variance table and result of the test of the null...
152 400 6. One of the authors collected data from a class to see whether humans...
 152 400 6. One of the authors collected data from a class to see whether humans made selections, as a random mumber generator would. Each of 38 students has to pick an integer from one to five. The data are summarized in the table. Integer Times Chosen One Two Three Four Five 3 5 14 11 A true random mumber generator would create roughly equal nuimbers of all five integers. Perform a goodness-of-fit analysis to test humans are not like...
An accounting class of 250 students is allocated into several tutorials to be taken by either...
 An accounting class of 250 students is allocated into several tutorials to be taken by either Tutor A and Tutor B. At the end of the semester the lecturer-in-charge looks at the distribution of marks by tutor. Table 1 provides this summary of the marks Table 1: Accounting student results according to their tutor Fail Credit Distinction Higher distinction 1 4 Pass Total Tutor A Tutor B Total 13 12 25 59 71 130 26 39 65 6 19 25...
Part (V) to (Viii) An accounting class of 250 students is allocated into several tutorials to...
 Part (V) to (Viii)
An accounting class of 250 students is allocated into several tutorials to be taken by either Tutor A and Tutor B. At the end of the semester the lecturer-in-charge looks at the distribution of marks by tutor. Table 1 provides this summary of the marks Table 1: Accounting student results according to their tutor Fail Credit Distinction Higher distinction 1 4 Pass Total Tutor A Tutor B Total 13 12 25 59 71 130 26 39...
Part (V) to (Viii)
An accounting class of 250 students is allocated into several tutorials to be taken by either Tutor A and Tutor B. At the end of the semester the lecturer-in-charge looks at the distribution of marks by tutor. Table 1 provides this summary of the marks Table 1: Accounting student results according to their tutor Fail Credit Distinction Higher distinction 1 4 Pass Total Tutor A Tutor B Total 13 12 25 59 71 130 26 39...
4 or 5 Total Assuming that a single student is randomly selected from the sample data:...
 4 or 5 Total Assuming that a single student is randomly selected from the sample data: (a) What is the probability that the student skips class sometimes, often or almost always and has an A average grade? (b) What is the probability that the student has an average grade of B or less? Yo What is the probability that the student skips class rarely or never, given that she/he has a B average grade? (d) Test at the 1% significance...
Organize and Display Data Data in the following data table were collected from a class of 9th grade students. ID...
 Organize and Display Data Data in the following data table were collected from a class of 9th grade students. ID Gender Height (m) Female 2 Weight (kg) Exercise per week 6 Days 4 Days 0 Days 1 Day 1 Day 0 Days 1 Day 4 Days 4 Days 7 Days 1 Day 2 Days 0 Days 2 Days 7 Days 0 Days 4 Days 6 Days 3 Days 2 Days 6 Days 5 Days 0 Days 0 Days 7 Days...
Question 5.[15 marks] [Chapters 7 and 8] Data from a random sample of a recent large second semester stage 2 statistics course (STATS 20x) were collected. Below is some information on the variabl...
 Question 5.[15 marks] [Chapters 7 and 8] Data from a random sample of a recent large second semester stage 2 statistics course (STATS 20x) were collected. Below is some information on the variables collected. Variable Grade The student's final grade for the course: A, B. C, D Pass Whether the student passed the course: Yes, No Programme The programme the student is enrolled in: BA, BCom BSc, Other Sex The student's sex: Female, Male ผhether the student regularly attended class:...
Use the following information to answer the next 4 questions./ Several semesters ago, a group of students took an SRS from the class roster, and asked each subject two questions: whether or not they...
 Use the following information to answer the next 4 questions./ Several semesters ago, a group of students took an SRS from the class roster, and asked each subject two questions: whether or not they own a maroon car and whether or not they come from an Aggie family. The results are given below. They wanted to use their data to test their hypothesis that a higher proportion of students from an Aggie family had maroon cars than students not from...
 The data stored in QuizPulse10 contains pulse rates collected from 10 students in a class lecture and then from the same students during a quiz. Use R to carry out all the necessary calculations. a. The 99% confidence interval for the difference in mean pulse rates between students in a class lecture and taking the quiz (Class lecture pulse rates quiz pulse rates) is (round to 4 decimal places): ( b, True or False-The probability that the true mean difference...
 A research team collected data on n= 450 students in a statistics course. The observed average final examination score was 524, with an observed standard deviation of 127.6 (the divisor in the estimated variance was n-1). The average first examination score was 397, with an observed standard deviation of 96.4. The correlation coefficient between the first examination score and the final examination score was 0.63. a. Report the analysis of variance table and result of the test of the null...
 152 400 6. One of the authors collected data from a class to see whether humans made selections, as a random mumber generator would. Each of 38 students has to pick an integer from one to five. The data are summarized in the table. Integer Times Chosen One Two Three Four Five 3 5 14 11 A true random mumber generator would create roughly equal nuimbers of all five integers. Perform a goodness-of-fit analysis to test humans are not like...
 An accounting class of 250 students is allocated into several tutorials to be taken by either Tutor A and Tutor B. At the end of the semester the lecturer-in-charge looks at the distribution of marks by tutor. Table 1 provides this summary of the marks Table 1: Accounting student results according to their tutor Fail Credit Distinction Higher distinction 1 4 Pass Total Tutor A Tutor B Total 13 12 25 59 71 130 26 39 65 6 19 25...
 Part (V) to (Viii)
An accounting class of 250 students is allocated into several tutorials to be taken by either Tutor A and Tutor B. At the end of the semester the lecturer-in-charge looks at the distribution of marks by tutor. Table 1 provides this summary of the marks Table 1: Accounting student results according to their tutor Fail Credit Distinction Higher distinction 1 4 Pass Total Tutor A Tutor B Total 13 12 25 59 71 130 26 39...
Part (V) to (Viii)
An accounting class of 250 students is allocated into several tutorials to be taken by either Tutor A and Tutor B. At the end of the semester the lecturer-in-charge looks at the distribution of marks by tutor. Table 1 provides this summary of the marks Table 1: Accounting student results according to their tutor Fail Credit Distinction Higher distinction 1 4 Pass Total Tutor A Tutor B Total 13 12 25 59 71 130 26 39...
 4 or 5 Total Assuming that a single student is randomly selected from the sample data: (a) What is the probability that the student skips class sometimes, often or almost always and has an A average grade? (b) What is the probability that the student has an average grade of B or less? Yo What is the probability that the student skips class rarely or never, given that she/he has a B average grade? (d) Test at the 1% significance...
 Organize and Display Data Data in the following data table were collected from a class of 9th grade students. ID Gender Height (m) Female 2 Weight (kg) Exercise per week 6 Days 4 Days 0 Days 1 Day 1 Day 0 Days 1 Day 4 Days 4 Days 7 Days 1 Day 2 Days 0 Days 2 Days 7 Days 0 Days 4 Days 6 Days 3 Days 2 Days 6 Days 5 Days 0 Days 0 Days 7 Days...
 Question 5.[15 marks] [Chapters 7 and 8] Data from a random sample of a recent large second semester stage 2 statistics course (STATS 20x) were collected. Below is some information on the variables collected. Variable Grade The student's final grade for the course: A, B. C, D Pass Whether the student passed the course: Yes, No Programme The programme the student is enrolled in: BA, BCom BSc, Other Sex The student's sex: Female, Male ผhether the student regularly attended class:...
 Use the following information to answer the next 4 questions./ Several semesters ago, a group of students took an SRS from the class roster, and asked each subject two questions: whether or not they own a maroon car and whether or not they come from an Aggie family. The results are given below. They wanted to use their data to test their hypothesis that a higher proportion of students from an Aggie family had maroon cars than students not from...
Most questions answered within 3 hours.
-
Where is the error in this code sequence?
String s1 = "Hello";
String s2 = "ello";...
asked 10 months ago -
Financial data for Joel de Paris, Inc., for last year
follow:
Joel de Paris, Inc.
Balance...
asked 10 months ago -
Consider this reaction:
Al2(SO4)3 (aq)+ BaCl3
(aq) Al2Cl6 (aq)- +
3BaSO4(s) . What is the...
asked 10 months ago -
Suppose that Savneet is considering increasing her
recent random sample from 20 car rentals to 40...
asked 10 months ago -
Trucks arrive at an unloading terminal at an average rate of 120
per hour.
Trucks arrive...
asked 10 months ago -
Why are methanol and ethanol completely soluble in water while
octanol is not very little soluble....
asked 10 months ago -
A facilities manager at a university reads in a research report
that the mean amount of...
asked 10 months ago -
When the CuSO4 is rehydrated by adding water to the anhydrous
compound, is this an endothermic...
asked 10 months ago -
A ray of sunlight is passing from diamond into crown glass; the
angle of incidence is...
asked 10 months ago -
A block of mass 0.249 kg is placed on top of a light, vertical
spring of...
asked 10 months ago -
how do the kidneys compensate in the presences of acidosis
a) trigger hyperventilate
b) reserve acid...
asked 10 months ago -
Question 501 pts
The rental rate of capital to the firm increases. Which of the
following...
asked 10 months ago