The following equations describe an economy. Y=C+I+G C=50+0.75*(Y-T) I=150-10r (M/P)d=Y-50r G=250 T=200 M=3,000 P=4 Identify each...
The following equations describe an economy.
Y=C+I+G
C=50+0.75*(Y-T)
I=150-10r
(M/P)d=Y-50r
G=250
T=200
M=3,000
P=4
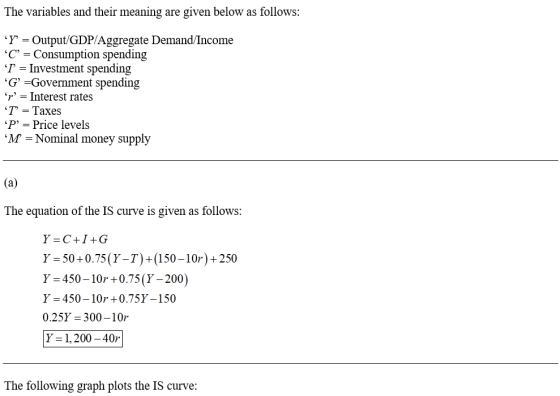
Identify each of the variables, and briefly explain their meaning.
From the above list, use the relevant set of equations to derive the IS curve. Graph the IS curve on an appropriately labeled graph.
From the above list, sue the relevant set of equations to derive the LM curve. Graph the LM curve on the same graph you used in part b).
What are the equilibrium level of income and the equilibrium interest rate?
Homework Answers


Add Answer to:
The following equations describe an economy.
Y=C+I+G
C=50+0.75*(Y-T)
I=150-10r
(M/P)d=Y-50r
G=250
T=200
M=3,000
P=4
Identify each...
1. Suppose an economy is represented by the following equations: C=500+.75(Y-T) I=1000 -50r (M/P)d=Y-200r G=1000 T=1000...
1. Suppose an economy is represented by the following equations: C=500+.75(Y-T) I=1000 -50r (M/P)d=Y-200r G=1000 T=1000 M=6000 P=2 Use these equations to derive both the IS and LM curves. Suppose that a newly elected president cuts taxes by 20%. Assuming that the money supply is held constant, what is the equilibrium interest rate in this economy? Round your answer to the nearest tenth. Do not use a percent sign when entering your answer. Your answer should not be given as...
2. (16 points) An economy is initially described by the following equations: C = 500+ 0.75(Y...
 2. (16 points) An economy is initially described by the following equations: C = 500+ 0.75(Y – T) I = 1,000 - 50r M/P=Y - 2007 G= 1,000 T= 1,000 M = 6,000 P=2 (a) Derive the equations for the IS curve and the LM curve. Note: Both equations should either show Y as a function of r only, or s as a function of Y only, like you've seen in class. (b) Solve for the equilibrium interest rate and...
9.9. The following equations describe an economy: C = 2000 +0.75 (Y - T) Ip =...
 9.9. The following equations describe an economy: C = 2000 +0.75 (Y - T) Ip = 600 - 50r G = 500 NX = 0 T= 400 Md/P = 0.25 Y - 50r Ms/P = 500 What is the equation that describes the IS curve? a. Y = 11200 - 200 r. b. 2800 +0.75Y - 50 r C. Y = 2800 - 50 r d. Y = 2000 + 200 r (4 Points) Enter your answer
Assume the following equations for the goods and money market of an economy: C = 250...
Assume the following equations for the goods and money market of an economy: C = 250 + .8(Y-T) I = 100 - 50r T = G = 100. Ms = 200 Md = 0.2Y – 100r a) Write the equation of the IS curve for this economy. Is this upward or downward sloping? The IS curve is written as Y = _ +/- _r. (6 points) b) If T falls to 50 and everything else remains the same, write the...
Which equation represents the LM curve?
 Consider an economy with the given equations. • Y=C+I+G • C = 88 +0.6(Y-T) • I = 110 - 10r •(M/P)d = Y - 15r • G=560 • T = $30 • M = $1200 • P = 3.0 Use the relevant set of equations to derive the LM curve. Move points A and B to graph the LM curve.Which equation represents the LM curve?
2. A small open economy is described by the following equations: C=50+0.75(Y-T) 1- 200 20 NX-200-50...
 2. A small open economy is described by the following equations: C=50+0.75(Y-T) 1- 200 20 NX-200-50 G- 200 T-200 M 3000 P-3 r' = 5 (a) Derive and graph the IS and LM* curves. (b) Calculate the equilibrium exchange rate, level of income, and net exports (c) Assume a floating exchange rate. Calculate what happens to the exchange rate, the level of income, net exports, and the money supply if the government increases spending by 50. Use a graph to...
1. Use the Keynesian cross model and show graphically in which direction will equilibrium level of...
1. Use the Keynesian cross model and show graphically in which direction will equilibrium level of income (or output) change. For each of the following, write down the formula for the size of the change of income (i.e. write down the formula for ∆Y): (i) An increase in government purchases (ii) An increase in taxes (iii) An increase in government purchase and an increase in taxes of equal amount (Nb: You must draw a SEPARATE graph for parts (i) and...
Assume the Chilean economy can be described as follows: C=200+0.25Yd l=150+0.25Y-1000r G=250 T=200 (M/P)d= L(r, Y)...
Assume the Chilean economy can be described as follows: C=200+0.25Yd l=150+0.25Y-1000r G=250 T=200 (M/P)d= L(r, Y) = 2Y- 8000r Ms=1840 P=1 a) Derive the equation for the LM curve. ( 1 .5 mk) b) Determine the slope af the LM curve. (0.5 mark) c) Derive the equation for the IS curve (I.S mk) d) Determine the slope ofthe IS curve. (0.5 mk) c) Compute the quilibrium values of income (Y) and interest rate (R)? (2 marks) [) Calculate the value...
Use the relevant set of equations to derive the IS curve and graph it in the...
 Use the relevant set of equations to derive the IS curve and graph it in the accompanying graph by moving points A and B to the correct locations Aggregate Demand I - Work It Out: Question 3 Consider an economy with the given equations. • Y=C+I+G • C = 78 +0.6(Y - T) . I = 150 - 10 CM' = Y - 150 • G= $30 • T = $30 • M = $800 • P = 2.0 ....
Stacked An economy is initially described by the following equations: C = 60+ 0.8(Y-T) I =...
 Stacked An economy is initially described by the following equations: C = 60+ 0.8(Y-T) I = 120-5 M/P = Y-25r G = 200 T = 200 M = 3000 P = 3 a. Derive and graph the IS and LM curves. Use the accompanying diagram to graph the IS and LM curves by placing the endpoints at the correct location, then place point A at the equilibrium interest rate and level of income. IS: Y= LM: Y= IS: Y= LM:...
 2. (16 points) An economy is initially described by the following equations: C = 500+ 0.75(Y – T) I = 1,000 - 50r M/P=Y - 2007 G= 1,000 T= 1,000 M = 6,000 P=2 (a) Derive the equations for the IS curve and the LM curve. Note: Both equations should either show Y as a function of r only, or s as a function of Y only, like you've seen in class. (b) Solve for the equilibrium interest rate and...
 9.9. The following equations describe an economy: C = 2000 +0.75 (Y - T) Ip = 600 - 50r G = 500 NX = 0 T= 400 Md/P = 0.25 Y - 50r Ms/P = 500 What is the equation that describes the IS curve? a. Y = 11200 - 200 r. b. 2800 +0.75Y - 50 r C. Y = 2800 - 50 r d. Y = 2000 + 200 r (4 Points) Enter your answer
 Consider an economy with the given equations. • Y=C+I+G • C = 88 +0.6(Y-T) • I = 110 - 10r •(M/P)d = Y - 15r • G=560 • T = $30 • M = $1200 • P = 3.0 Use the relevant set of equations to derive the LM curve. Move points A and B to graph the LM curve.Which equation represents the LM curve?
 2. A small open economy is described by the following equations: C=50+0.75(Y-T) 1- 200 20 NX-200-50 G- 200 T-200 M 3000 P-3 r' = 5 (a) Derive and graph the IS and LM* curves. (b) Calculate the equilibrium exchange rate, level of income, and net exports (c) Assume a floating exchange rate. Calculate what happens to the exchange rate, the level of income, net exports, and the money supply if the government increases spending by 50. Use a graph to...
 Use the relevant set of equations to derive the IS curve and graph it in the accompanying graph by moving points A and B to the correct locations Aggregate Demand I - Work It Out: Question 3 Consider an economy with the given equations. • Y=C+I+G • C = 78 +0.6(Y - T) . I = 150 - 10 CM' = Y - 150 • G= $30 • T = $30 • M = $800 • P = 2.0 ....
 Stacked An economy is initially described by the following equations: C = 60+ 0.8(Y-T) I = 120-5 M/P = Y-25r G = 200 T = 200 M = 3000 P = 3 a. Derive and graph the IS and LM curves. Use the accompanying diagram to graph the IS and LM curves by placing the endpoints at the correct location, then place point A at the equilibrium interest rate and level of income. IS: Y= LM: Y= IS: Y= LM:...
Most questions answered within 3 hours.
-
Where is the error in this code sequence?
String s1 = "Hello";
String s2 = "ello";...
asked 11 months ago -
Financial data for Joel de Paris, Inc., for last year
follow:
Joel de Paris, Inc.
Balance...
asked 11 months ago -
Consider this reaction:
Al2(SO4)3 (aq)+ BaCl3
(aq) Al2Cl6 (aq)- +
3BaSO4(s) . What is the...
asked 11 months ago -
Suppose that Savneet is considering increasing her
recent random sample from 20 car rentals to 40...
asked 11 months ago -
Trucks arrive at an unloading terminal at an average rate of 120
per hour.
Trucks arrive...
asked 11 months ago -
Why are methanol and ethanol completely soluble in water while
octanol is not very little soluble....
asked 11 months ago -
A facilities manager at a university reads in a research report
that the mean amount of...
asked 11 months ago -
When the CuSO4 is rehydrated by adding water to the anhydrous
compound, is this an endothermic...
asked 11 months ago -
A ray of sunlight is passing from diamond into crown glass; the
angle of incidence is...
asked 11 months ago -
A block of mass 0.249 kg is placed on top of a light, vertical
spring of...
asked 11 months ago -
how do the kidneys compensate in the presences of acidosis
a) trigger hyperventilate
b) reserve acid...
asked 11 months ago -
Question 501 pts
The rental rate of capital to the firm increases. Which of the
following...
asked 11 months ago